Do these 3 things before closing this tab:
1Fix the driver behind crashes, sound loss and screen glitches2Clear out junk files and repair common Windows errors3Scan for outdated or missing drivers - takes under a minuteA higher horsepower rating does not guarantee a quicker drag car. A drag race rewards the vehicle that converts its available power into forward acceleration over the entire distance. A more powerful car can lose when it is heavier, cannot transfer engine torque through its tires, unloads the driven wheels at launch, uses unsuitable gearing or slow shifts, or encounters more aerodynamic drag as speed rises.
The meaningful comparison is therefore complete-car performance: mass, measured power, traction, weight distribution, drivetrain, gearing, launch and shift strategy, aerodynamic resistance, and the exact race conditions. Peak horsepower is potential; elapsed time shows how much of that potential reached the track.
As an Amazon Associate I earn from qualifying purchases.
What a drag race actually measures
Horsepower is a rate, not an acceleration guarantee
Horsepower describes how quickly an engine or motor can do work. It is useful for comparing output, but a drag race measures how quickly a complete vehicle covers a set distance. The car must create usable force at the contact patches, keep the tires connected to the surface, and sustain acceleration as speed changes.
Recommended Free Tools
Two cars can show different peak figures yet produce similar—or opposite—results across the run. A peak number may occur only in a narrow engine-speed range, while the winner may spend much of the race outside that point. The power delivered at each instant, after gearing and traction limits, matters more than the largest number on a specification sheet.
#1 Best Overall

- With a tread width of 14" and a section width of 17.7", this tire is meticulously crafted for maximum grip and control.
- Designed for rear use, this tire boasts an approximate diameter of 32.3" and is recommended for a 14" rim, ensuring seamless compatibility and a snug fit for enhanced performance.
- Stocked in our Lincoln, NE Warehouse
- With a tire size of 32 x 14-15 and bias-ply construction, this tire is engineered for high-speed drag cars, ensuring superior traction and stability on the track.
- Trusted by drag racers worldwide, this tire combines cutting-edge technology with years of racing expertise, delivering consistent performance and reliability that you can count on to dominate the track.
Mass changes the acceleration job
For a given tractive force, a heavier car accelerates less because the force must move more mass. That is why power and vehicle weight are fundamental performance parameters. A high-output car carrying substantially more bodywork, equipment, fuel or driver weight can have a less favorable power-to-weight relationship than a lower-output rival.
Use the same definition of mass for both cars—ideally race-ready mass with the driver and the fuel level used for the run. Comparing one car’s brochure curb weight with another car’s ready-to-race weight can make the horsepower comparison meaningless.
Traction determines whether power becomes acceleration
Tire friction sets a practical ceiling
The driven tires can transmit only a limited amount of force before they spin. Tire compound, construction, temperature, pressure, tread condition and the track surface all influence that limit. In a traction-limited car, adding engine output can produce more wheelspin rather than a quicker launch. The 1996 SAE vehicle-simulation study identified tire friction as one of the influential factors in acceleration, but it modeled a specific traction-limited manual-transmission vehicle rather than every possible car.
Specialized drag racing slick tires can provide a different grip level from ordinary street tires, yet no tire automatically guarantees a lower elapsed time. The tire must be matched to the car’s load, power delivery, suspension and surface. A setup that works on a prepared strip can behave differently on an unprepared or cooler surface.
Weight transfer changes the load on the driven axle
Acceleration shifts load toward the rear of the vehicle. That can help a rear-wheel-drive car keep its driven tires planted, while a front-wheel-drive car may unload the tires responsible for propulsion. All-wheel drive distributes the task across more tires, but its result still depends on calibration, torque distribution and available grip.
Rank #2

- Increased Traction with new Ultra Blue Compound
- Less break-in or Conditioning Required
- Molded-in High-Performance Herringbone Weave Pattern Belt
- Specifically Made for No-Prep Drag Racing
- Made in the USA
Rear weight bias was an influential parameter in the cited simulation. NASA Speed News’ instructional material on weight transfer likewise emphasizes that suspension behavior, chassis layout and tire loading interact. The exact benefit is setup-dependent: a launch that improves one car’s grip can make another car squat, wheel-hop or overload a tire.
Launch control is part of the powertrain
The first fraction of a second can decide a short race. Applying maximum torque instantly may exceed the tire’s friction limit, so a driver or control system may manage throttle, clutch engagement, boost or motor torque to stay near the available grip. A less powerful car with a clean, repeatable launch can gain enough distance before the higher-powered car hooks up.
The Tool Desk
Outbyte PC Repair FREERepair Windows errors before they cause bigger problemsFix Now →Outbyte Driver Updater FREEScan for outdated or missing drivers - takes under a minuteDriver Scan →Gearing and shifts decide how much power is usable
Ratios keep the engine in its useful range
Torque at the crankshaft is multiplied by the transmission and final-drive ratios, then reduced by drivetrain losses. Shorter gearing can increase wheel force but may require an early shift; taller gearing can reduce wheel force while keeping the car in gear longer. The right choice depends on the engine’s torque curve, tire diameter, final drive and race distance.
A car with a high peak horsepower figure may fall below its effective power band after a shift or spend too little time at the rpm where it makes that peak. A rival with a broader torque curve, closer ratios or a better-matched final drive can deliver more average wheel power through the measured distance.
Shift time and shift quality cost distance
During a shift, torque at the wheels can drop. Slow manual shifts, clutch slip, wheelspin after the shift or an automatic transmission’s protective intervention all increase elapsed time. The relevant question is not simply how many gears a car has, but how its ratios, shift timing and torque management keep acceleration continuous.
Rank #3
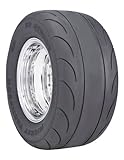
- Soft compound for superior traction on the strip
- Special sidewall construction for quick launches
- Radial construction for excellent ride control
- Low void, directional tread for maximum dry traction
- Works best with auto trans applications
What the 2026 electric drag example shows
In its 2026 report on the Ford Racing Mustang Cobra Jet 2200 electric drag car, the National Hot Rod Association described controlled launch torque and multiple ratios used to keep the motors in a useful operating range. This is an example of the general principle that an electric drag car still has to manage torque and gearing; it is not evidence that every electric or combustion powertrain uses the same strategy.
Why aerodynamic drag matters more as speed rises
Acceleration is not one constant phase
At low speed, tire grip, launch force and gearing usually dominate the opening part of a run. Aerodynamic resistance grows rapidly with speed, so an advantage that appears at the start can shrink later. A car with a large frontal area, high drag coefficient, exposed hardware or an aerodynamic setup optimized for downforce may need more power to continue accelerating at the top end.
That does not mean drag decides every race or that downforce is always harmful. Downforce can increase tire loading and improve traction, while the associated aerodynamic resistance consumes some available power. The useful setup depends on whether the car is traction-limited, power-limited or drag-limited at each part of the course.
What the historical acceleration study found
An SAE study titled Determinants of Multiple Measures of Acceleration analyzed 107 Consumers Union-tested vehicles from the 1986–1988 model years. It reported that power and weight provided the most information about acceleration capability in its data, while aerodynamic-drag proxies tended to matter in higher-speed equations rather than start-up acceleration equations. Because the sample and vehicles are historical, the result should be read as evidence about that dataset—not as a universal modern race-time formula.
How to compare two cars without being misled by horsepower
Before declaring one car faster on paper, align the variables that determine the actual contest.
Free tools Windows power users keep installed
One-click scans. No signup required.
Rank #4

- Traxxas 9475X - Mickey Thompson ET Rear Drag Tires on Weld Wheels, Bk Chrome (2)
- Features:
- Includes:
- Specs:
- Part number(s) included (in factory packaging): 9475X
| Comparison item | What to record | Why it changes the result |
|---|---|---|
| Race format | Distance, rollout rule, reaction-time treatment and start procedure | A standing start, a rolling start and different timing conventions measure different things. |
| Vehicle mass | Race-ready mass including driver, fuel and safety equipment | More mass requires more force to achieve the same acceleration. |
| Power measurement | Engine or wheel horsepower, test method, correction and operating conditions | Figures from different measurement points or methods are not directly interchangeable. |
| Tires and surface | Compound, construction, temperature, pressure, condition and track preparation | Grip determines whether torque becomes forward force or wheelspin. |
| Driven wheels | Front-, rear- or all-wheel drive and torque distribution | Weight transfer can load or unload the tires doing the work. |
| Transmission | Gear ratios, final drive, shift time, launch control and torque management | Gearing determines wheel force and whether the power source stays in its useful range. |
| Results | Elapsed time, trap speed and, when available, incremental times | Elapsed time shows who covered the distance sooner; trap speed helps reveal top-end performance. |
A horsepower figure is meaningful only when its measurement conditions and the rest of this list are comparable. The cited SAE performance-design work supports evaluating the complete vehicle rather than ranking engines by a single peak value.
Independent reader supportYour contribution helps us test, update, and keep practical guides available for everyone.Diagnosing why the more powerful car lost
If it lost immediately after the launch
- Look for wheelspin, wheel hop or a visible reduction in throttle. Those signs point toward a tire-load or torque-delivery limit.
- Check driven-wheel layout and rearward load transfer. The tires may have been unloaded or asked to accept more torque than the surface could transmit.
- Compare launch rpm, clutch or converter behavior, boost buildup and traction-control intervention. A conservative launch can be faster than an uncontrolled one.
If it was ahead early but lost in the middle
- Examine shift points and shift duration. A ratio that drops the engine below its effective range can erase an initial advantage.
- Check whether the transmission is protecting the drivetrain or reducing torque during shifts.
- Compare tire temperature and pressure after repeated runs. Grip can change as the tire and track heat up.
If it lost near the finish
- Compare trap speed as well as elapsed time. A lower trap speed can indicate that the car’s power-to-weight ratio, gearing or aerodynamic resistance limits its top end.
- Consider frontal area and drag. Resistance becomes increasingly important as speed rises, even when launch traction is excellent.
- Verify that both cars ran the same distance and timing procedure. A different rollout or finish line can create an apparent top-end loss.
Common horsepower mistakes
Treating peak horsepower as average power
Peak horsepower is a single point on an output curve. Acceleration uses the output available through every gear and every engine speed encountered. A car with a lower peak but stronger output across the run may produce more average wheel force.
Ignoring the driver and control strategy
Two identical cars can record different times because of launch technique, shift timing, throttle modulation and reaction to wheelspin. If reaction time is included in the published result, separate it from the vehicle’s elapsed time before drawing a mechanical conclusion.
Mixing unlike test numbers
Engine horsepower, chassis-dynamometer wheel horsepower and manufacturer estimates answer different questions. Correction factors, weather, fuel, calibration and test equipment also affect the result. Use like-for-like measurements or state the uncertainty rather than ranking cars from incompatible figures.
Quick wins for a faster PC:
Fix the driver behind crashes, sound loss and screen glitchesFind Drivers →Repair Windows errors before they cause bigger problemsFix Now →What the drag-tire research does—and does not—prove
Chuck Hallum’s SAE paper The Magic of the Drag Tire presents a theoretical drag-tire model and compares its performance predictions with fuel drag-car data. Its abstract states: “A theoretical model of the drag tire is presented and performance predictions of Fuel drag cars is compared to race car data.” That work helps explain why tire behavior deserves engineering attention, but it is not a consumer tire recommendation, a guaranteed setup or a result for every street car.
The practical rule for predicting a winner
Predict the car that can maintain the greatest usable wheel force over the complete distance, after accounting for mass, traction, load distribution, gearing, shifts and aerodynamic resistance. A powerful car loses when one of those limits prevents its extra output from becoming acceleration. To find the real reason, use matched conditions and inspect where the time was lost rather than treating the horsepower badge as the verdict.
Quick Recap
Product prices and availability are accurate as of the date/time indicated and are subject to change. Any price and availability information displayed on Amazon at the time of purchase will apply.