Advertised fuel economy and electric range are standardized estimates, not guarantees for an individual trip. In the United States, the Environmental Protection Agency (EPA) tests vehicles in controlled laboratory cycles so shoppers can compare models on a common basis. Your actual result can be higher or lower because your speed, route, weather, heating or air-conditioning use, cargo, driving habits, road conditions, maintenance and even the individual vehicle differ from the test conditions.
That does not mean the window sticker is misleading. It answers a narrower question: how did this vehicle perform under a repeatable test method, and how does that compare with other vehicles tested the same way? EPA states that its ratings are “estimates to use in comparing the gas mileage of different vehicles” and “not meant as a guarantee of the gas mileage each driver will achieve.”

As an Amazon Associate I earn from qualifying purchases.
What the EPA number actually tells you
U.S. new-car and light-truck labels are based on procedures defined by the EPA. Automakers submit test data, and the EPA says it confirms approximately 15% of test results. The laboratory setting controls variables such as temperature, speed profile and route so that different models can be evaluated consistently.
The label is therefore most useful for comparing vehicles tested under the same model-year methodology, category and configuration. It is not a prediction of every owner’s commute. The EPA’s consumer FAQ puts the limitation plainly: “Since no test can simulate all the possible conditions that affect fuel economy, such as climate, driver behavior, road condition, and car care habits, your actual mileage will always vary some from the estimates.”
#1 Best Overall
U.S. procedures have changed over time. The EPA revised testing for model-year 2008 vehicles in 2006 and later updated some calculations for model year 2017. Check the current label and official procedure when comparing vehicles from different years.
For background on the U.S. label system, see the EPA’s Basic Information on Fuel Economy Labeling.
How gasoline and hybrid fuel-economy estimates are produced
Modern U.S. estimates generally use five laboratory cycles. The cycles represent different kinds of use, and the final label value reflects an EPA adjustment and combination of the results.
Do these 3 things before closing this tab:
1Clear out junk files and repair common Windows errors2Scan for outdated or missing drivers - takes under a minute3Repair Windows errors before they cause bigger problems| Test cycle | What it represents | Conditions highlighted by the EPA |
|---|---|---|
| City | Stop-and-go urban driving | Repeated acceleration, braking and lower speeds, without HVAC use in the basic cycle |
| Highway | Free-flow driving | Steadier speeds, without HVAC use in the basic cycle |
| High-speed/aggressive | Faster driving and more forceful acceleration and braking | Higher speeds and more aggressive inputs than the standard city and highway schedules |
| Hot-weather air conditioning | Driving in heat with climate control operating | A 95°F test with air conditioning |
| Cold-weather driving | Winter operation | A 20°F test with heat and defrost settings |
The U.S. Department of Energy describes these cycles as standardized versions of city traffic, free-flow highway travel, aggressive driving, hot-weather air conditioning and cold-weather operation. The EPA also adjusts for influences a laboratory cannot fully reproduce, including wind, hills and changing road surfaces. The five-cycle method is a model of typical use, not a replay of your exact route.
See the DOE explanation of the five test cycles for the consumer descriptions of each schedule.
Why your real-world MPG can be different
Speed, route and traffic
Speed is one of the largest practical variables. A long trip at a high freeway speed, a steep route, frequent stop-and-go traffic or extensive idling may use more fuel than the label’s combined mix. A driver whose daily trips closely resemble the city cycle can see a different result from someone who drives mostly at steady highway speed; neither result invalidates the rating.
Temperature and climate control
Cold starts, winter temperatures, cabin heat, windshield defrost and hot-weather air conditioning all consume energy or make the powertrain work harder. EPA testing includes a 95°F air-conditioning cycle and a 20°F cycle with heat and defrost, but your actual temperature, trip length and HVAC settings can be more demanding or more favorable.
The Tool Desk
Outbyte Driver Updater FREEScan for outdated or missing drivers - takes under a minuteDriver Scan →Outbyte PC Repair FREEClear out junk files and repair common Windows errorsFree Scan →Driving behavior and trip pattern
Rapid acceleration, late braking, high engine speed, frequent short trips and long periods of idling can reduce MPG. Smooth inputs, anticipating traffic and combining errands can improve it. Remote starts and extended warm-ups count as fuel use even though the car may not travel any additional miles.
Passengers, cargo and accessories
Additional people, luggage, roof equipment and other loads increase the work required to move the vehicle. Accessories and electrical demand can also affect results. EPA’s label guidance specifically calls attention to load and accessory use when explaining why individual mileage varies.
Tires, brakes and other maintenance
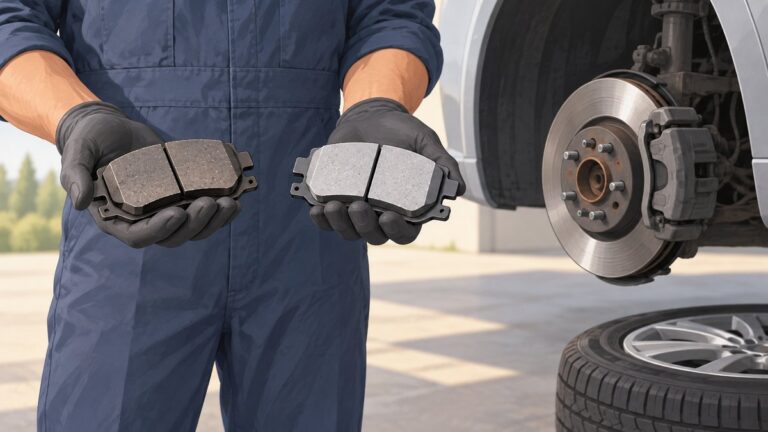
Underinflated tires increase rolling resistance. A dragging brake, incorrect fluid level, restricted air cleaner, emissions fault or other mechanical problem can have a larger effect. Tire pressure is an important check, but it is not a complete explanation for every poor result. Use the pressure listed on the vehicle’s door-jamb label or owner’s manual, not the maximum pressure molded into the tire sidewall.
Rank #3

- Plug and Play: This automotive gauge is easy to install, requiring no complicated wiring or professional installation; it connects directly to the vehicle's system.
- Fuel Economy Monitoring: Designed to help track and optimize fuel consumption, allowing drivers to monitor vehicle efficiency and potentially reduce fuel costs.
- Portable Design: This compact and lightweight gauge can be easily moved between different vehicles or removed when not needed. This fuel economy monitor can easily fit into your armrest box.
- Universal Compatibility: Suitable for vehicles using gasoline, diesel, water, and lubricants, making it suitable for a wide range of automotive applications.
Fuel, vehicle variation and break-in
Fuel properties, manufacturing variation between individual vehicles and engine break-in can influence results. EPA says fuel economy may improve with mileage up to approximately 20,000 miles, particularly during the first 1,000–2,000 miles. That is a general EPA observation, not a promise that a specific vehicle will gain a particular amount.
Free tools Windows power users keep installed
One-click scans. No signup required.
Why an EV’s displayed range may not match the label
EPA range testing takes place on a laboratory dynamometer. A fully charged EV is driven repeatedly on a city cycle until it can no longer proceed, then the process is repeated from a full charge on the highway cycle. Automakers may use an allowed multi-cycle procedure instead.
The EPA adjusts laboratory results for factors that the basic cycles do not fully represent, including air-conditioning demand, cold temperatures and high-speed or aggressive driving. The most common adjustment described by the EPA is a factor of 0.7, although regulations allow optional approaches. In the EPA’s illustrative example, a 200-mile highway laboratory result multiplied by 0.7 produces 140 adjusted miles. That is an example of the method, not a universal factor or prediction for every EV.
| EV range calculation stage | What happens |
|---|---|
| City and highway tests | The vehicle is repeatedly driven on each laboratory cycle from a full charge. |
| Adjustment | EPA applies an approved adjustment for conditions such as HVAC use, cold weather and aggressive or high-speed driving. The common example is 0.7, but other permitted approaches exist. |
| Combined label range | Adjusted city range receives a 55% weight and adjusted highway range a 45% weight. |
Because the combined figure is weighted 55% city and 45% highway, it should not be read as a promise that the vehicle will travel that distance on one cold, fast highway trip. The range shown on the label means approximate combined city/highway distance before recharging. A dashboard range projection is also an estimate based on recent use, not independent proof that the EPA figure is wrong.
The EPA’s text version of the Electric Vehicle Label, updated May 22, 2026, explains the range and energy-use information presented to shoppers.
Recommended Free Tools
Rank #4

- Adjusts speed limiter
- Read and erase trouble codes
- See instant fuel economy
- Customize gauges and set safety warnings
How to measure your own result accurately
Gasoline, diesel and hybrid MPG
Use a consistent fill-and-record method rather than relying on one short trip or the car’s instantaneous display. EPA recommends measuring at least half a tank, preferably more, and averaging two or three tanks.
- Fill the tank completely and record the odometer reading or reset the trip meter.
- Drive normally for at least half a tank. For a useful comparison, avoid unusually long idling or remote starts during the measurement period.
- Refill using the same method and record the gallons purchased and the miles driven.
- Calculate MPG as miles driven divided by gallons purchased.
- Repeat for two or three tanks and average the results. A longer average smooths out differences caused by one trip, pump shutoff or weather event.
To separate city and highway performance, measure representative city and highway trips independently. Keep the route, speed pattern, load and HVAC use typical for the type of driving you are trying to compare.
Electric-vehicle range
There is no single owner-level test in the cited EPA material that reproduces the official EV procedure. For a meaningful personal comparison, keep conditions as similar as possible: use similar routes and speeds, start with a comparable state of charge, and note outside temperature, heating or air-conditioning use, wind, payload and traffic. Compare energy consumed per distance as well as the projected miles remaining. A cold-weather, high-speed test and a mild-weather, moderate-speed test answer different questions.
How to compare two vehicles without misreading the labels
Use the same basis for both vehicles:
- Match the EPA model year, vehicle category and configuration, including drivetrain, body style and tire package where applicable.
- Compare combined MPG or combined range, then inspect the separate city and highway figures.
- For operating cost, also compare energy consumed per distance, such as gallons or kilowatt-hours per 100 miles. Consumption per 100 miles relates more directly to energy use and cost than MPG alone.
- Adjust the decision for your own route mix, typical speeds, climate, HVAC use, cargo and maintenance condition.
A higher combined label number is a useful starting point, not proof that it will deliver the best result on your particular commute. The fairest personal comparison uses the conditions you actually expect to repeat.
When a poor result deserves a service check
A modest difference under different conditions is normal. Investigate when fuel economy is excessively low or suddenly falls without an obvious change in route, weather, load or driving style. EPA’s suggested diagnostic areas include:
- Diagnostic trouble codes and warning lights
- Dragging brakes or abnormal brake heat
- Transmission operation
- Ignition timing and other engine-control issues
- Driving habits, idling and vehicle load
- Emissions components and vacuum hoses
- Tire pressure
- Fuel type, fuel quality, fuel pressure or leaks
- Air cleaner condition and coolant-related problems
These are checks a qualified technician may perform, not a remote diagnosis. Start with simple observations—tire pressure, visible leaks, warning lights and a change in driving conditions—then arrange service if the unexplained loss persists. The EPA’s transportation FAQ provides the consumer guidance on why actual mileage differs and what mechanics may check.
Geography and limits of the figures
This explanation applies to U.S. EPA labels. Other markets use different test systems, cycles and weighting, so the U.S. five-cycle method and 55%/45% EV weighting should not be generalized worldwide. No universal percentage shortfall applies to every new vehicle: the difference depends on the car, trim, tires, route, climate, speed, load, maintenance and measurement method.
Quick Recap
Product prices and availability are accurate as of the date/time indicated and are subject to change. Any price and availability information displayed on Amazon at the time of purchase will apply.
What’s actually slowing this PC down?
Pick the symptom - the matching free tool is one click away.