Windows Errors? Fix Them Before They Spread
Repair common Windows errors and clear accumulated junk for a smoother, more stable PC - no reinstall needed.Free scan · no reinstallOutdated Drivers Are Slowing You Down
One free scan finds every outdated or missing driver and matches the right update for your exact hardware.Free scan · exact hardware matchSchool-bus diesel bills rise when crude oil, refining margins, distillate inventories, seasonal demand, delivery costs, taxes or local competition push up the delivered price. A district cannot control those market forces, but it can control or influence gallons consumed, purchasing terms, route design, idling, maintenance and the way price risk is budgeted.
What makes school bus diesel costs rise?
A school district’s fuel invoice is the product of two variables: the price paid per gallon and the number of gallons used. Each moves for different reasons. Separating them is the first step toward deciding what a transportation department can actually change.
As an Amazon Associate I earn from qualifying purchases.
The price at the pump or tank has several components
The U.S. Energy Information Administration (EIA) describes retail diesel as a combination of crude-oil cost, refining costs and margins, distribution and marketing, retail operating costs and profits, and federal, state, county and local taxes. The share of each component changes over time and differs by region. A district’s delivered bulk price can also reflect freight, storage, supplier margins, contract adjustments and local competition.
Quick wins for a faster PC:
Fix the driver behind crashes, sound loss and screen glitchesFind Drivers →Clear out junk files and repair common Windows errorsFree Scan →Scan for outdated or missing drivers - takes under a minuteDriver Scan →Crude oil is the largest long-run influence, but it is not the entire explanation. EIA reports that crude oil accounted for about 51% of the monthly average U.S. retail on-highway diesel price from 2004 through 2025. That is a historical national average, not a fixed formula for a particular fleet, month or contract.
#1 Best Overall
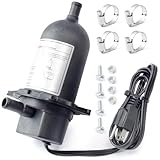
- Compatibility: Compatible with Diesel & Gas engines Generator Tractor Truck Bus Boat Marine etc. Please carefully compare every details of yours with the pictures before placing order
- Replace Part Number: TPS151GT10-000 Engine Heater replace TPS151GT8-000, TPS151GT12-000, TPS151GT10-005, 590-893, 52748, 24597503, KHTPS151GT10-005, KHTPS151GT10-000, for generac:84918G, 084918G (Please have in mind for generac it may have a 6' cord, this one has the standard 4' cord)
- Efficient Preheat: Provides 1500 watts of power output at 120 volts, which can quickly raise the coolant temperature in a short period of time, ensuring that the engine can be started smoothly even in cold weather and reducing wear and tear
- Temperature Control: It offers a temperature adjustment range of 100-120°F, allowing flexible adjustment of the preheating effect according to different environmental needs, reducing heat loss, and ensuring the equipment operates optimally at all times
- High Durability: Made of excellent materials, sturdy and shockproof, with excellent high temperature resistance. Sturdy shell and precision internal structure, making the heater more reliable, reducing maintenance and replacement costs
Refining margins and distillate supply can move quickly
Diesel is made in refineries, and the spread between crude-oil prices and the value of refined distillate is commonly called the crack spread. Refinery outages, maintenance, limited refining capacity, import changes, pipeline or trucking constraints and low inventories can widen that spread even when crude prices are stable. Heating-oil demand in colder months and agricultural demand during planting and harvest can compete for the same distillate pool used for transportation diesel.
Taxes, logistics and local conditions matter
Taxes vary by state and locality. Distribution costs rise when fuel must travel farther or when trucking capacity is tight. A rural district may face a different delivered price from a district near a major terminal, even on the same day. Bulk storage, minimum-delivery requirements and the timing of a purchase can further separate a district’s invoice from a published retail average.
A dated national example
EIA reported a U.S. retail on-highway diesel average of $6.29 per gallon in September 2026. It attributed the increase to higher crude-oil prices and rising crack spreads. EIA expected national distillate prices to remain above $6 per gallon in October before declining gradually, while warning that low inventories could keep prices elevated. This is national retail context and a time-limited forecast; it is not a quote for a school district’s delivered fuel.
Do these 3 things before closing this tab:
1Repair Windows errors before they cause bigger problems2Scan for outdated or missing drivers - takes under a minute3Clear out junk files and repair common Windows errorsWhich school bus fuel costs can a district control?
District leaders have little influence over global crude prices, national inventories or refinery outages. They do have authority over operational decisions that change gallons, and over contracts and budgeting that change exposure to price swings.
| Cost or exposure | District control | What to measure |
|---|---|---|
| Crude-oil and national diesel price | None; plan for it rather than trying to set it | Local bid history and multiple price scenarios |
| Taxes and statewide fuel rules | Usually none, apart from verifying exemptions or correct billing | Tax lines on invoices and applicable state rules |
| Supplier margin, delivery and contract terms | Influence through bids, negotiation, delivery timing and contract design | Delivered price, index or surcharge formula, fees, storage and reliability |
| Gallons consumed on required routes | Influence through route efficiency, vehicle condition and driver practices | Gallons per mile, miles per route, deadhead miles and utilization |
| Unnecessary idling | Directly controllable through policy, supervision and equipment | Idle hours by vehicle and fuel used during idle periods |
| Non-required trips and service design | District decision, subject to policy, contracts and student needs | Trip miles, riders, cost per trip and service impact |
How can school districts save money on diesel?
The strongest plan combines gallons reduction with disciplined purchasing and a budget that shows price and volume separately. The measures below are levers, not guaranteed savings. Local routes, bus engines, weather, labor rules and service obligations determine the result.
Rank #2

- Pre-Heat: Diesel and Gas engines, construction equipment, trucks, marine and industrial applications
- Heating Fluid: Engine Coolant, Water, other No pump needed (thermosiphon principle)
- Engine Displacement: 350 – 500 CID (5.7–8.2 L)
- Volts: 120v - kW: 1.5 - AMPS: 12.5 - 60Hz
- Temperature Range: ON: 100°F (38°C) – OFF 120°F (49°C)
1. Set and enforce an anti-idling policy
The Environmental Protection Agency states: “Unnecessary school bus idling affects human health, pollutes the air, wastes fuel, and causes excess engine wear.” A written policy should define when idling is permitted for safety, extreme weather, mechanical protection or accessibility, and when it is prohibited. It should cover school loading zones, layovers, athletic events and driver warm-up practices.
- Record baseline idle hours or fuel-use data by bus, route and operating period.
- Define exceptions and a maximum permitted idle time that drivers can apply consistently.
- Train drivers, dispatchers and school-site staff; signage and administrator support matter at loading areas.
- Review telematics or fuel reports monthly and coach repeat outliers.
- Estimate potential savings with EPA’s Diesel Emissions Quantifier using local idle hours, fuel price and vehicle information.
The EPA tool produces an estimate based on the inputs supplied; it is not a promise that every bus will achieve the calculated amount.
2. Evaluate heaters as part of an idle-reduction program
EPA identifies heaters as one possible way to reduce cold-weather idling and lists potential benefits including fuel savings, lower emissions, longer oil life and less engine wear. A district must verify compatibility with the exact bus and engine, climate, duty cycle, electrical system, installation requirements, maintenance capability and total cost of ownership. A heater that is unsuitable for a particular fleet can add expense without delivering the intended operating benefit.
3. Remove avoidable route miles
Transportation staff can examine duplicate streets, inefficient stop sequences, excess deadheading between runs, poorly timed transfers and buses operating far below practical capacity. Route changes must preserve safe walking paths, special-needs transportation, bell schedules, maximum ride-time policies, driver work rules and local legal requirements.
A May 2026 survey by AASA, ASBO International and NAPT found that 40% of respondents reported consolidating bus routes or adjusting route efficiency for the 2025–26 school year. A 2008 congressional hearing record also described rerouting, stop consolidation and deadheading reduction as practices used at that time. Neither source reports the savings from an individual change, so districts should compare proposed mileage reductions with implementation and service costs.
Rank #3

- Uses include snow blowers, chainsaws, snowmobiles, or other small engines
- Applications can include oil pan, engine block, battery holder or intake manifold
- May also be used for warming hydraulic systems or thawing frozen gutters, livestock feeders, locks, and pipes
- Convenient, reliable with no mechanical installation
- Thermostatically controlled
4. Use fuel-efficient driving and preventive maintenance
Smooth acceleration, avoiding unnecessary high-speed operation, correct tire inflation and timely repair can reduce waste, although the effect varies by bus and route. Driver training and maintenance practices were documented in the 2008 congressional hearing record; that historical evidence does not establish a current national adoption rate or a universal savings percentage.
Track gallons per mile by vehicle and route rather than judging a bus against the fleet average without context. A special-needs route, winter operation or heavy urban traffic may legitimately consume more fuel than a rural, lightly loaded run.
5. Investigate unusual fuel consumption
Fuel-system reports can flag a bus that consumes more than expected for its assigned miles and duty cycle. The Florida Office of Program Policy Analysis and Government Accountability has described monitoring fuel data as a way to identify possible maintenance needs or unauthorized fuel use. An outlier is a prompt for investigation, not proof of misconduct.
- Check odometer or telematics accuracy and fuel-card assignment.
- Compare route miles, idle hours, weather and passenger-load conditions.
- Inspect for tire, brake, engine, emissions-system or fuel-system problems.
- Review fueling locations, dates, quantities and duplicate transactions.
- Document the finding and corrective action before changing a route or disciplining an employee.
What are school districts doing about rising diesel prices?
The following results come from the May 2026 AASA, ASBO International and NAPT survey of district experiences in the 2025–26 school year. Responses can overlap, so the percentages are not exclusive shares and should not be added to produce a single response rate.
| Reported response | Respondents reporting it |
|---|---|
| Absorbed extra costs in the existing transportation budget | 63% |
| Transferred funding from other district funds or programs | 32% |
| Used district reserves or rainy-day funds | 19% |
| Additional costs were not yet covered | 15% |
| Consolidated routes or adjusted route efficiency | 40% |
| Enforced anti-idling measures | 27% |
| Reduced the number of routes | 25% |
| Limited non-required trips, such as field trips | 20% |
| Changed fuel-purchasing practices | 14% |
| Increased the walk-to-stop ratio | 8% |
| Moved away from yellow buses to non-diesel vehicles | 7% |
| Negotiated contracts with transportation vendors | 6% |
The survey is a snapshot of reported experience. It does not show which response saved the most money, whether every district was represented, or whether a response caused the reported budget result. Moving money from reserves can close a current-year gap while increasing future budget risk.
Rank #4

- Reference Part Number: Engine Block Heater 1153, 1155, 1155X with specifications of 120 Volts, 60 HZ, and 200 Watts for reliable engine heating performance
- Wide Range of Applications: Uses include cars, trucks, tractors, snow blowers, chainsaws, snowmobiles, and other equipment for heating engine block, oil pan, battery holder, intake manifold, small engine equipment, or hydraulic systems
- Engine Heating Function: This electric heater warms the engine of a vehicle to provide quicker starts and helps minimize wear on engine components during cold weather starts, promoting longevity
- Durable Construction: Built from high-quality materials, this heater is designed to withstand harsh weather conditions with robust construction that ensures reliable performance for cold weather engine protection
- Convenient Installation: Magnetic design allows for easy attachment to desired location without mechanical installation, simply plug in for instant heat transmission to help start your engine in freezing temperatures
How should a district manage diesel-price exposure?
Compare delivered-cost purchasing options
Request comparable bids that show the all-in delivered price, minimum volumes, delivery fees, storage and handling, payment timing, emergency-delivery terms and supplier reliability. Compare spot purchasing, scheduled deliveries, bulk storage and contract pricing only after putting them on the same delivered-cost basis.
Contracts may use an index, a fixed margin or a fuel surcharge. Ask exactly what index is used, how often it resets, whether taxes and freight are passed through, and what happens when the index falls. Price certainty has a cost: a fixed or capped price may protect a budget during a spike but can exceed spot prices when the market declines.
Treat hedging as a specialized risk decision
The 2008 congressional hearing record documented operators using bulk purchases and hedging. That historical record does not establish that either method is currently available, affordable or beneficial for a particular district. Any financial hedge requires legal, accounting and procurement review, clear authority, collateral or cash-flow analysis where applicable, and a policy for gains and losses. It should not be adopted merely because fuel prices are high.
Use scenarios instead of one forecast
Build a spreadsheet that keeps price and volume separate:
Recommended Free Tools
Annual diesel cost = gallons consumed × delivered price per gallonStart with the fleet’s actual gallons and local bid price. Then model a low, central and high price case, plus a volume case for route changes, anti-idling and service changes. Show the effect of each assumption independently so the board can see whether a budget increase comes from the market, more miles, more idle time, a larger fleet or a combination.
Best Value

- Compatibility: Replacement for Ford for F-250 for F-350 7.3L for Powerstroke Diesel 1995-2003. Replacement for Ford 7.3L Diesel engines in any vehicle, Pickup Trucks, Vans, Towtrucks all 1995-2003
- Replace Part Number: Replace F7TZ-6A051-AA. Please carefully check the model/part number/year to ensure it is suitable for your car
- Durability: Manufactured from quality materials under strict quality control to ensure longer service life. Able to withstand harsh environments and provide long-lasting and stable heating effect
- Efficient Heating: The heater can help preheat, effectively shorten the start-up time in cold weather, reduce equipment wear and tear, improve the starting efficiency and running performance
- Easy Installation: The replacement process is quick and easy, no need to modify the original system, direct replacement, saving time and installation costs
Include a contingency or reserve policy that states who can authorize transfers, when a fuel surcharge can be reopened, and what service reductions require board approval. The 2026 survey shows that districts are using existing budgets, transfers and reserves, but it does not establish those approaches as sustainable.
A practical decision framework for each proposed change
Before approving a route redesign, heater installation, contract change or alternative-fuel transition, evaluate the same questions:
- Expected gallons reduced: Use local miles, idle hours and fuel records; label estimates clearly.
- Upfront and recurring cost: Include equipment, installation, software, staff time, maintenance and training.
- Compatibility: Check bus age, engine, climate, route pattern, fueling infrastructure and contract constraints.
- Student safety and service: Test walking distances, ride times, accessibility, bell schedules and required trips.
- Implementation effort: Identify procurement steps, labor consultation, communications and rollout time.
- Price certainty: State whether the action changes the per-gallon price, the gallons used, or only the timing of purchases.
- Supplier and contract risk: Review delivery reliability, termination rights, index formulas and emergency provisions.
- Evidence quality: Separate measured results from a general potential benefit or a historical example.
Common mistakes that make fuel budgets worse
- Using a national retail average as if it were the district’s delivered bulk price.
- Applying the historical 51% crude-oil share as a permanent formula.
- Promising a fixed idling or heater savings amount without local baseline data.
- Cutting routes or non-required trips without accounting for accessibility, safety and community effects.
- Comparing supplier bids without including freight, taxes, storage, minimums and surcharge rules.
- Treating a fuel-report outlier as proof of unauthorized use before checking measurement and route conditions.
- Assuming a survey percentage measures savings or ranks the best intervention.
- Reducing reserve balances without a plan for the next price spike.
What to put in the transportation director’s monthly report
A concise dashboard can make market and operating causes visible before the budget is out of control:
- Average delivered price per gallon, with taxes, freight and fees shown separately.
- Total gallons and total diesel cost, compared with the same month and budget.
- Gallons per mile by bus and route, with exceptions explained.
- Idle hours, anti-idling compliance and repeat outliers.
- Deadhead miles, route miles, bus utilization and non-required-trip miles.
- Open maintenance findings linked to abnormal consumption.
- Supplier performance, contract-index changes and upcoming delivery commitments.
- Scenario-based year-end projection at several fuel prices.
This format lets leaders answer two different questions: “Did the market make each gallon more expensive?” and “Did our operations use more gallons than planned?” Those answers lead to different actions.
Bottom line for district leaders
Diesel prices rise because a global commodity passes through refining, distribution, taxes and local market conditions before reaching a school bus tank. Districts cannot eliminate that exposure. They can reduce the number of gallons consumed, improve the quality of their fuel data, negotiate transparent delivered-cost terms and budget with explicit price scenarios. Start with anti-idling, route and maintenance data, then test purchasing or service changes against safety, compatibility, total cost and evidence quality. The objective is not immunity from diesel markets; it is fewer wasted gallons and a budget that shows exactly which part of the bill the district can influence.
Quick Recap
Product prices and availability are accurate as of the date/time indicated and are subject to change. Any price and availability information displayed on Amazon at the time of purchase will apply.