Quick wins for a faster PC:
Fix the driver behind crashes, sound loss and screen glitchesFind Drivers →Clear out junk files and repair common Windows errorsFree Scan →Scan for outdated or missing drivers - takes under a minuteDriver Scan →A published 0–60-mph time is a controlled measurement, not a guarantee of what every driver will see on an ordinary road. The result depends on when the timer starts, how the launch is performed, tire setup, weather, wind, vehicle load and the test surface. Road acceleration adds traffic, changing grip, temperature, gradients and driver inputs.
Use 0–60 as a useful comparison only when the timing convention and test conditions match. For a fuller picture, pair it with launch and rolling measures such as 0–30, 30–50 and 50–70 mph.
As an Amazon Associate I earn from qualifying purchases.
What a 0–60 time actually measures
In its simplest form, 0–60 is the elapsed time from a defined starting condition until a vehicle reaches 60 mph. The important word is defined. A test must decide exactly when time begins, how the car is positioned, which tires and pressures are used, what vehicle mode is selected and how environmental effects are handled.
The Tool Desk
Outbyte PC Repair FREEClear out junk files and repair common Windows errorsFree Scan →Outbyte Driver Updater FREEScan for outdated or missing drivers - takes under a minuteDriver Scan →Those choices do not change the car’s physical acceleration. They change the measurement attached to it. Two credible outlets can test the same vehicle and publish different numbers without either test being dishonest, because their procedures may start the clock differently or use different launch and averaging rules.
#1 Best Overall
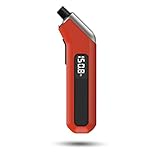
- PROCESS LEVEL ACCURACY: Each ETENWOLF’s digital tire pressure gauge is calibrated manually to ANSI B40.7 Grade 2A(plus-minus 1 PSI).Presta valve adapter not included, if used for bicycles, it must be purchased separately
- ACCURACY IN EXTREME PRESSURE RANGE: Whether tire pressure is below 12 PSI or above 140 PSI, ETENWOLF’s digital tire gauge is accurate as well
- ACCURACY IN EXTREME WEATHER: Built-in AI chip with thermal compensation inside, ETENWOLF’s tire gauge works normally even in extreme cold or hot weather(-4°F-130°F/-20°C-54°C)
- PRESSURE RANGE 3-200 PSI : ETENWOLF’s digital tire pressure gauge can measure pressure of all types of vehicles
- REPLACEABLE AAA BATTERIES: Batteries are easy to replace and helps to extend the tire pressure gauge’s life span, with LED light to illuminate dark areas for easy tire pressure reading
Time zero and the one-foot rollout
SAE recommended practice J1491, revised May 5, 2025, is intended to support repeatable measurements of maximum acceleration for launch and passing maneuvers and to standardize time zero. Its public description establishes that scope, but it does not expose every detailed procedure in the full standard.
Car and Driver uses a one-foot rollout for its standing-start acceleration figures. The car begins moving before the timed distance officially starts, and the publication subtracts the time needed to cover that first foot. Its method page, accessed in 2026, says the rollout is typically about 0.3 second and provides rollout times so readers can calculate a true zero-to-60 result.
That roughly 0.3-second value belongs to Car and Driver’s stated procedure. It is not a universal correction for every magazine, manufacturer test or independent video. A true-from-rest result and a rollout-adjusted result should never be compared as if they used the same clock.
Free tools Windows power users keep installed
One-click scans. No signup required.
One number can hide several runs
Professional testing generally involves repeated attempts rather than one casual launch. Car and Driver varies launch technique where appropriate, records multiple runs and averages its best runs in opposite directions. Averaging opposite directions helps reduce the effect of a headwind or tailwind. The published figure therefore represents a selected, repeatable test process, not an average commuter launch.
Why a controlled test can be quicker than an everyday launch
A test driver’s job is to remove avoidable variation and find the vehicle’s strongest repeatable performance. A road driver’s job is usually to move safely and smoothly. The gap between those goals explains much of the difference.
Launch technique and vehicle modes
Modern cars may offer launch control, a performance transmission mode or stability-control settings that alter how torque reaches the tires. A tester can warm the vehicle, select the most favorable permitted mode and repeat the procedure until the best result is found. A normal driver may leave the car in its everyday setting, lift off the brake less aggressively or avoid wheelspin to protect the tires and drivetrain.
Rank #2

- Accurate, Dependable Readings: Factory‑calibrated to ±1 PSI, so you can confidently match your vehicle’s recommended PSI (check the door jamb sticker). Ideal for monthly checks and road trips — consistent results every time, cold or warm.
- Bright Backlit Display & Nozzle Light: The illuminated nozzle helps you find the valve stem in the dark, while the backlit LCD makes readings crystal clear in dim garages or at night. No more squinting or holding a flashlight.
- 4 Measurement Units, One Button: Quickly switch among PSI, Bar, Kgf/cm², and KPA with a single press. No complex settings — just press and cycle to your preferred unit. Perfect for drivers who need multiple scales.
- Broad Compatibility for Everyday Vehicles: 0–150 PSI covers cars, SUVs, motorcycles, and spare tires (often 60 PSI). Fits standard Schrader valves; just press on for a reading.
- Auto‑Off to Extend Battery Life: The gauge automatically powers down after 30 seconds of inactivity, so the included 2*AAA batteries last longer. Always ready for your monthly checks without surprise dead batteries.
Even without a special mode, throttle timing matters. Too little throttle wastes available traction and delays the engine or motor’s climb into its strongest operating range. Too much can spin the tires, trigger traction intervention or force an automatic transmission to reduce torque. The quickest launch is usually a narrow balance between available power and available grip.
Wind, direction and surface
Wind changes the air the vehicle must push through and can slightly assist or resist forward motion. A single run in one direction can therefore exaggerate or reduce performance. Car and Driver addresses this by testing in opposite directions and averaging its best runs. A road trip may include gusts, crosswinds, uneven pavement, painted markings, gravel or a surface that is damp in one lane and dry in another.
Track preparation also matters. A clean, level, consistent surface lets a tester repeat launches. Public roads are rarely uniform. A small crest, downhill grade or patch of polished asphalt can change the result without any change to the powertrain.
Weather and air conditions
Car and Driver records weather and corrects acceleration results to 60 degrees Fahrenheit at sea level. Temperature, pressure and humidity affect engine power, air density, cooling and tire grip. That correction makes results easier to compare, but it does not mean every car actually performed under those conditions.
On a cold morning, a combustion engine may produce a different amount of power than it does on a hot afternoon. Batteries, motors, fluids and tires also respond to temperature. Humidity and barometric pressure change the air available to an engine, while a hot surface can alter tire behavior. These effects interact, so no single weather adjustment predicts every vehicle equally.
Tires, pressure and vehicle setup
Car and Driver sets its test tires to the manufacturer-recommended cold pressure. That detail matters because pressure affects the tire’s contact behavior, temperature buildup and available grip. It does not mean tire pressure alone controls acceleration or that matching the door-jamb recommendation will reproduce a magazine result.
Rank #3

- PROCESS LEVEL ACCURACY: This heavy duty tire pressure gauge is calibrated manually to ANSI B40.1 Grade A (±1% of span)
- PRESSURE RANGE 0-75 PSI: ETENWOLF’s tire gauge can measure pressure of pickup, motorcycle, truck, bike, SUV, RV or ATV
- EASY TO READ IN THE DARKNESS: The large glow dial helps you clearly read the pressure at night or in low light
- EASY TO USE: 360 degree swivel chuck allows you to measure and take a reading from a tire valve at any angle
- ACCURACY IN EXTREME WEATHER: PSI gauge works normally even in extreme cold or hot weather
A 1996 SAE simulation and correlation study of a traction-limited manual-transmission vehicle identified tire friction, rear weight bias, engine inertia and total vehicle weight as influential variables apart from horsepower. Those findings belong to that studied vehicle and model; they are useful context, not a universal ranking for every modern car.
Vehicle load is another practical difference. A test car may carry only the required equipment and instrumentation. A daily driver might have passengers, luggage, a full cargo area or a roof box. Added mass increases the energy needed to reach 60 mph and can change axle loading and traction.
What changes during real-world acceleration
On-road acceleration is not one repeatable event. It is a sequence of decisions made in changing conditions. The SAE paper published in 2026 describes vehicle speed, acceleration, temperature and wind during on-road testing as unpredictable. It provides a way to account for those variables in its testing context, but it does not establish a universal number of seconds that road driving adds to a published 0–60 time.
Windows Errors? Fix Them Before They Spread
Repair common Windows errors and clear accumulated junk for a smoother, more stable PC - no reinstall needed.Free scan · no reinstallOutdated Drivers Are Slowing You Down
One free scan finds every outdated or missing driver and matches the right update for your exact hardware.Free scan · exact hardware matchSurface grip and traction limits
Dry, clean asphalt generally offers more predictable grip than wet pavement, loose material or a painted line. A front-wheel-drive car may unload its driven tires during a hard launch, while a rear-drive car may transfer weight rearward and improve traction. All-wheel drive can distribute torque across more tires, but it still cannot create grip where the surface has little friction.
Electronic traction control adds another variable. If the system detects wheelspin, it may reduce power until the tires recover. That intervention can make a launch slower but more controllable. Turning the system off may change the result again, and doing so can be inappropriate on a public road.
Driver inputs, traffic and safety
A test driver can choose an empty, straight, level section and commit to full acceleration. A road driver must check traffic, merge space, pedestrians, speed limits and surface hazards. The accelerator may be applied progressively, interrupted for a bend or lifted before 60 mph. Those are sensible driving choices, but they make the event unlike a timed test.
Rank #4

- HIGH ACCURACY: Every ETENWOLF's pencil tire gauge is calibrated to ANSI B40.1 Grade B, it is accurate to 2% of span in the middle 50% of range and 3% of span in the lower and upper 25% of range. Each ETENWOLF pencil tire pressure gauge is manually calibrated and has its unique calibration number printed on the pencil
- WIDER RANGE: ETENWOLF's tire gauge offers 2 pressure ranges: 10-50PSI, 20-120PSI for all types of vehicles
- ALL METAL: ETENWOLF tire gauges are made of all solid metal, zinc alloy head and stainless steel body, they are durable and can be used for many years unless you lose them
- DEFLATION: You can also use ETENWOLF's tire gauge to deflate tires when the tire pressure is overinflated
- 16 CAPS IN 2 CASES: ETENWOLF even offers 16 valve stem caps, so you won't worry about losing tire caps anymore
Steering input also matters. A vehicle accelerating while turning cannot use its tires solely for forward force; some grip is needed for cornering. A passenger, trailer or uneven load can further change how the car responds. Consequently, a real-world launch is best understood as a context-dependent experience rather than a fixed alternative test number.
Which variables matter most when comparing published figures?
Before treating a decimal-place difference as meaningful, check the measurement axes below. A comparison is strongest when the entries in each column match.
| Comparison axis | What to check | Why it changes the result |
|---|---|---|
| Time-zero convention | True zero from rest or one-foot rollout; whether rollout time is disclosed | Starting the clock after the first foot removes part of the measured launch time |
| Launch setup | Launch control, transmission mode, stability-control setting and driver technique | Torque delivery and wheelspin control can alter the first seconds |
| Tires and pressure | Tire type, condition and cold pressure | Available friction and tire behavior determine how much power reaches the road |
| Vehicle condition | Fuel level, occupants, cargo and temperature of the powertrain | Mass and thermal state affect acceleration and traction |
| Environment | Temperature, pressure, humidity, wind, grade and surface | Air density, resistance and grip vary with conditions |
| Run selection | Single best run, average, or opposite-direction average | A single direction or standout attempt may reflect wind or an unusual launch |
| Acceleration phase | Standing 0–60, 0–30 launch, or rolling 30–50/50–70 | Each metric emphasizes a different part of the powertrain’s response |
Why 0–60 is not the whole acceleration story
The Environmental Protection Agency’s technical appendix hosted by NHTSA separates overall acceleration from launch and passing performance. It lists 0–30 mph as a launch-oriented measure and 30–50 mph and 50–70 mph as rolling or passing ranges, alongside overall 0–60 mph performance.
0–30 mph: the launch phase
0–30 places more emphasis on initial traction, torque delivery, gearing and the driver’s first throttle application. A vehicle with strong low-speed grip can feel exceptionally forceful here even if its later power delivery is less dramatic. Conversely, a car that struggles to put power down may post a respectable 0–60 after recovering speed above 30 mph.
30–50 and 50–70 mph: rolling response
Rolling measures show how the car responds after launch, when traction is often less limiting. Gear selection, turbocharger response, electric-motor output, battery state and transmission kickdown become prominent. These ranges resemble merging or overtaking more closely than a standing start, although real traffic still prevents a controlled one-to-one comparison.
Do these 3 things before closing this tab:
1Fix the driver behind crashes, sound loss and screen glitches2Clear out junk files and repair common Windows errors3Scan for outdated or missing drivers - takes under a minuteUse the metric that matches the question
If you want to understand a stoplight launch, examine 0–30 and the test’s time-zero convention. If you care about joining a highway or passing, rolling measurements are more informative. A single 0–60 number cannot reveal whether a car is quick because of its launch, its midrange power or both.
Best Value

- RUGGED DESIGN: The stainless steel components prevent rust and corrosion while the precision-crafted nozzle seamlessly seals onto the valve stems for highly accurate readings (±2% span). We also provide 4 valve stem caps for convenient replacement.
- MEASURES PSI, kPa, BAR; Measurement range from 10-75 PSI, 70-550 kPa, 0.7-5.5 BAR. Attention! Do not exceed the maximum pressure of the gauge, doing so will permanently damage the device.
- UNIVERSAL APPLICATION: Not only are these gauges easy to use, but include an integrated deflator valve, chuck, and ABS indicator bar
- CONVENIENT DESIGN stows easily in a glove box, tool belt, workbench, or even a pocket; the pocket clip makes it easy to carry with you while on the job
- Further service provided by AstroAI, BATTERY FREE means no maintenance and total reliability under all weather conditions; a necessary tool for roadtrips and optimal safety
How to compare two 0–60 claims fairly
- Identify the source and procedure. Record whether the figure comes from a manufacturer, magazine, laboratory or owner and whether the method is explained.
- Check time zero. Confirm true-from-rest timing versus one-foot rollout. If rollout is used, find out whether the adjustment is stated.
- Match the vehicle specification. Compare the same drivetrain, transmission, tires, body style, model year and performance package. Small equipment differences can change mass and traction.
- Read the environmental notes. Look for temperature, pressure, humidity, wind, surface and grade. A corrected result may be easier to compare, but it remains a correction to a particular run.
- Check run selection. Prefer a procedure that explains repeated attempts and direction, rather than assuming one spectacular run represents normal performance.
- Look beyond 0–60. Add 0–30 and rolling 30–50 or 50–70 data when available, especially if your concern is launch feel or passing response.
- Treat tiny gaps cautiously. If two results differ by only a few hundredths, differences in timing convention, surface, weather or launch execution may be larger than the displayed gap.
A practical way to control one variable at home
If you are comparing your own vehicle’s behavior over time, begin with the simplest repeatable check: cold tire pressure. Measure it before driving and match the vehicle maker’s recommended cold pressure shown on the door-jamb label or in the owner’s manual. Record the tire type, load, temperature and road direction as well.
This can make your observations more consistent, but it will not turn a public-road run into a professional test. Do not use a traffic lane as a testing facility, disable safety systems where it would be unsafe or illegal, or chase a published number. A closed course and appropriate supervision are required for meaningful performance testing.
What the numbers can and cannot tell you
A published 0–60 time can tell you how quickly a specific vehicle reached 60 mph under a stated procedure. It is valuable for comparing cars tested under similar conventions and conditions. It cannot tell you exactly how quickly your loaded car will accelerate on a cold, wet, windy road, nor can it describe every passing or merging situation.
Recommended Free Tools
There is no evidence here for a universal seconds penalty between a published result and everyday driving. The difference may be small in favorable conditions and much larger when grip, temperature, load, traffic or driver caution changes. The scientifically honest conclusion is qualitative: controlled testing reduces variation; road driving contains it.
The practical takeaway
Read 0–60 as a method-dependent benchmark. Check the clock’s start, rollout, launch technique, tire pressure, vehicle load, weather and direction before comparing figures. Then consult launch and rolling metrics to understand where the car is actually quick. That approach turns a headline decimal into useful information about how the vehicle is likely to behave in the situations that matter to you.
Quick Recap
Product prices and availability are accurate as of the date/time indicated and are subject to change. Any price and availability information displayed on Amazon at the time of purchase will apply.