Free tools Windows power users keep installed
One-click scans. No signup required.
To find out what a Toyota Corolla or Honda Civic will really cost you, compare both cars over the same ownership period and add the expenses you will actually pay: depreciation, loan interest, fuel, insurance, maintenance and repairs, taxes, registration, and other recurring costs such as parking. Use quotes and estimates for your location and driving habits; the two cars’ starting prices alone cannot establish which will cost less to own.
A 2026 base-trim comparison provides a useful starting point, not a personal ownership-cost total: the Corolla LE is listed at a $23,125 starting MSRP and 35 mpg combined, while the Civic LX is listed at $24,695 and 36 mpg combined. The calculation below shows how to turn those reference figures—and your own inputs—into a fair comparison.


As an Amazon Associate I earn from qualifying purchases.
What belongs in a total cost of ownership calculation?
Total cost of ownership (TCO) is the cost of acquiring and using a car over a defined period, after accounting for what you may recover when you sell it. The period might be five years, but use the time you realistically expect to keep the car. A three-year lease, a ten-year ownership plan, and a five-year comparison answer different questions.
The Tool Desk
Outbyte PC Repair FREERepair Windows errors before they cause bigger problemsFix Now →Outbyte Driver Updater FREEFix the driver behind crashes, sound loss and screen glitchesFind Drivers →For a useful Corolla-versus-Civic comparison, separate the costs into categories rather than relying on a single advertised payment or a generic national estimate:
- Acquisition and depreciation: the price and eligible acquisition costs, less the vehicle’s estimated resale or trade-in value at the end of your period.
- Financing: interest paid on a loan. If you buy in cash, decide whether you want to include an opportunity cost for using that money; if you do, state the assumption.
- Fuel: fuel consumed over your expected miles, priced using a local or otherwise specified fuel-price assumption.
- Insurance: a quote for the relevant driver, address, coverage, deductibles, and expected annual mileage.
- Maintenance and repairs: scheduled service, wear items, and repairs not covered by a warranty or prepaid maintenance plan.
- Taxes, registration, and fees: purchase taxes and title or registration charges, plus recurring charges where applicable.
- Other use costs: parking, tolls, or other expenses only if they belong in your definition of ownership cost.
Toyota’s TCO guidance identifies purchase price, financing, insurance, maintenance, fuel or electricity, and depreciation as key expenses; its guidance also includes taxes and fees, registration, and recurring costs such as parking. Choose the categories before comparing so you do not omit a cost from one car or count it twice.
Economic cost is not the same as cash flow
For an economic-cost comparison, count the car’s loss in value—not both its full purchase price and its full loss in value. If you capitalize a purchase price and eligible acquisition costs, depreciation is that amount minus expected resale proceeds. Add loan interest, not loan principal, because the purchase price is already represented in the depreciation calculation.
A cash-flow view answers a different question: how much money must you pay and when? It can show the down payment, loan payments, running expenses, and eventual resale proceeds. Do not add that cash-flow total to the economic-cost total; they are two ways of looking at the same ownership period, not expenses to combine.
Which Corolla and Civic figures can you use as a starting point?
Toyota’s 2026 Corolla-versus-Civic comparison lists these base-trim figures. They are reference points for that model year and comparison, not an estimate of what an individual buyer will pay.
| 2026 base trim | Starting MSRP in Toyota’s comparison | Delivery charge listed in that comparison | EPA-estimated fuel economy | Scheduled maintenance term reported in Toyota’s comparison |
|---|---|---|---|---|
| Toyota Corolla LE | $23,125 | $1,295 | 35 mpg combined | 24 months or 25,000 miles |
| Honda Civic LX | $24,695 | $1,295 | 36 mpg combined | 12 months or 12,000 miles |
Toyota’s comparison reports a 36-month/36,000-mile whole-vehicle warranty for each car. A warranty and scheduled maintenance are not interchangeable: warranty coverage does not pay for every repair, exclude-free wear item, or routine service. Confirm applicable warranty and maintenance terms in the purchase documents for your vehicle and location.
Honda’s comparison gives city/highway/combined ratings of 32/41/35 mpg for the Corolla LE and 32/41/36 mpg for the Civic LX. Honda states that its mileage figures are for comparison purposes and that real mileage varies with driving, maintenance, conditions, and other factors. Treat EPA estimates as consistent comparison inputs, not a promise of your own fuel economy. These gasoline base-trim numbers should not be carried over to hybrid trims, other model years, or different powertrains.
Rank #3

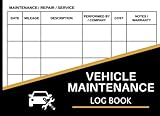
- 110 Sheets Log Book: This vehicle maintenance log book includes 110 record sheets to track repairs, services, fuel costs, and other vehicle-related expenses. It also comes with 36 convenient “Service Due” stickers to help remind you of upcoming maintenance schedules. Everything you need to keep your car records organized in one place.
- Detailed Information: Each page is carefully structured with dedicated sections for date, mileage, service description, parts replaced, vehicle information, cost, and additional notes. The clear and organized format allows you to maintain accurate records, monitor repair history, and better manage long-term vehicle performance and expenses.
- Enough Writing Space: The record sheets provide ample space for clear and thorough entries. Whether you’re documenting routine oil changes or major repairs, there’s plenty of room to write detailed information without feeling cramped.
- Easy to Use: The spiral binding allows the notebook to lay flat for comfortable writing, making entries quick and convenient. The included 36 “Service Due” stickers can be placed inside the book or on visible surfaces like your windshield or dashboard, helping you keep important maintenance reminders in sight.
- Proper Size: This compact logbook measures 5.5” x 7.1”, which fits easily in your glove compartment, center console, backpack, or desk drawer. Its portable size ensures you can access and update your vehicle records anytime, whether at home, in the garage, or at the service center.
The listed MSRPs do not equal a buyer’s final acquisition cost. Your negotiated price, dealer add-ons, taxes, title, registration, and location-specific charges can change the amount. Both listed delivery charges are figures in Toyota’s cited 2026 comparison; check the current price and purchase documents for your market. The comparison’s figures are time-sensitive, and the source pages were accessed October 9, 2026.
Do these 3 things before closing this tab:
1Repair Windows errors before they cause bigger problems2Scan for outdated or missing drivers - takes under a minute3Clear out junk files and repair common Windows errorsGather matching inputs before you calculate
The fairest comparison uses the same period and assumptions for both cars. Match as many of these variables as apply to your decision:
- Vehicle: model year, body style, trim, powertrain, and whether it is new or used. Do not compare a hybrid with a gasoline model and interpret the result as a Corolla-versus-Civic comparison without identifying the powertrain difference.
- Acquisition: actual price, destination or delivery charge, dealer add-ons, sales tax, title, registration, and other fees in your location.
- Financing: down payment, amount financed, APR, loan term, and total interest. For cash purchases, decide whether to model opportunity cost and use a clearly stated assumption.
- Use: annual mileage, expected city/highway mix, ownership length, and local fuel price. Choose EPA combined mpg for a standardized estimate or observed mileage for a more personalized one.
- Insurance: quotes based on the same driver, location, liability and other coverage limits, deductibles, and annual mileage.
- Upkeep: maintenance schedule, likely wear items and repairs, vehicle condition and mileage, and any applicable warranty or prepaid service.
- Exit value: expected resale or trade-in value at the end of the chosen period, with age, mileage, condition, and the valuation source or estimate stated.
- Recurring local costs: taxes, registration renewals, parking, tolls, or other items you have chosen to include.
Insurance and resale are especially dependent on the individual driver, place, vehicle condition, and market. Toyota notes that insurance varies with location, vehicle type, driving history, and policy, and that fuel costs vary with efficiency and changing fuel prices. Replace generic assumptions with quotes or explain precisely what you assumed; an official base-trim comparison alone cannot yield a defensible personal total.
Calculate ownership cost step by step
- Set the time horizon and total miles. Choose how many months or years you will own the car. Multiply annual miles by years for a level-mileage estimate, or enter each year separately if mileage changes.
- Find your acquisition amount. Use the actual negotiated price, then add the taxes and fees you have decided belong in the calculation. Keep a record of which items are included so they are treated identically for both cars.
- Estimate end-of-period resale proceeds. Use a named valuation source or a transparent estimate for the car’s expected age, mileage, condition, and market. Do not assume the value of a new car based only on its MSRP.
- Calculate depreciation. Subtract estimated resale proceeds from the acquisition amount used in your economic-cost model. This is the capital-value cost for the period.
- Calculate loan interest. Use the lender’s payment schedule or total repayment figure. Subtract the amount financed from total loan payments to find interest. If the purchase price is represented through depreciation, do not add loan principal again.
- Estimate fuel. Apply the same annual mileage and fuel-price assumptions to both cars. Use the EPA combined rating for a controlled comparison, or an observed figure if it better reflects your own driving.
- Add insurance, upkeep, and remaining expenses. Use matching insurance quotes; estimate maintenance and repairs for the specific year, mileage, condition, and coverage; and add taxes, registration, parking, or other recurring costs included in your scope.
- Calculate the total and normalize it. Add the economic-cost categories. Divide by the number of months for average monthly cost or by total miles for cost per mile.
- Keep a separate cash-flow worksheet if needed. Show when payments are due, including the purchase cash, loan payments, running costs, and resale proceeds. Label this view separately from economic cost.
Core formulas
- Fuel cost per year = annual miles ÷ expected miles per gallon × fuel price per gallon.
- Fuel cost over ownership = annual fuel cost × years owned, or the sum of each year’s fuel cost if miles or fuel prices change.
- Loan interest = total loan payments − amount financed.
- Depreciation = acquisition amount used in the model − expected resale or trade-in proceeds.
- Total economic ownership cost = depreciation + loan interest + fuel + insurance + maintenance and repairs + included taxes, registration, parking, tolls, and other use costs.
- Average monthly cost = total economic ownership cost ÷ number of months owned.
- Cost per mile = total economic ownership cost ÷ total miles driven.
If costs vary materially over time, calculate them year by year rather than assuming every year is identical. That is particularly useful when annual mileage, insurance premiums, fuel prices, or maintenance needs are expected to change.
Worked example: isolate the fuel-cost difference
The following is an illustration of the fuel calculation only, not a full ownership-cost estimate or a forecast for a typical driver. It uses an assumed 12,000 miles per year for five years, a constant assumed fuel price of $3.50 per gallon, and the 2026 combined EPA estimates in Toyota’s comparison. Actual results depend on the driver, route, maintenance, conditions, and fuel price.
Outdated Drivers Are Slowing You Down
One free scan finds every outdated or missing driver and matches the right update for your exact hardware.Free scan · exact hardware matchPC Slower Than It Used to Be?
A free scan shows the junk files, broken settings and background clutter dragging Windows down - then fixes them in one click.Free scan · Windows 10 & 11At those assumptions, each car is driven 60,000 miles. The Corolla LE’s estimated fuel use is 60,000 ÷ 35, or about 1,714 gallons; at $3.50 per gallon, that is about $6,000 over five years. The Civic LX’s estimated fuel use is 60,000 ÷ 36, or about 1,667 gallons; at the same price, that is about $5,833. The estimated difference is about $167 in favor of the Civic for fuel under this particular scenario.
Best Value

- Made in USA - Proudly produced in Ohio by a Veteran-owned business
- This book will help you remember your last oil change /last service appointment. You can easily track all services, mileage and maintenance for multiple automobiles - great for business or personal use.
- The yearly expense summary is a very important part of this book. The yearly summary page is a perfect tool for your tax prep and your budget. After every month you should log your total business miles and personal miles in the “Annual Mileage Summary” page.
- This book comes in two convenient sizes, 8.5” x 11” - perfect to fit into any binder or clipboard that you may use for business and 5” x 7” which is the perfect size to fit into your glove compartment!
- Our unique cover is a semi-rigid transparent cover that leads to a sturdy book that resists stains and wrinkles. Reorder SKU: LOG-100-57CW-PP(Auto-Maintenance)
This result reflects a one-mpg difference in the stated base-trim combined ratings. It does not establish which car has lower total ownership cost: acquisition price, financing, insurance, maintenance and repairs, depreciation, and local fees are not included. If your observed mpg, annual mileage, or fuel price differs, replace the assumptions and recalculate rather than applying the example’s dollar result to your situation.
Independent reader supportYour contribution helps us test, update, and keep practical guides available for everyone.Compare the complete result, not just one headline number
Once you have collected the inputs, keep a side-by-side worksheet. The categories below help show where a difference comes from. Fill each vehicle’s column from the same ownership period and matched assumptions; do not treat a missing quote or estimate as zero.
| Cost category | Corolla | Civic | Input to use |
|---|---|---|---|
| Acquisition amount | Your figure | Your figure | Negotiated price plus the taxes and fees included in your method |
| Estimated resale proceeds | Your figure | Your figure | End date, age, mileage, condition, and named valuation source or transparent estimate |
| Depreciation | Acquisition minus resale | Acquisition minus resale | Use the same definition of acquisition cost for both |
| Financing interest | Your figure | Your figure | Loan schedule or total payments minus amount financed |
| Fuel | Your calculation | Your calculation | Same annual miles and fuel-price assumption, with each car’s chosen mpg |
| Insurance | Your quote | Your quote | Same driver, location, coverage, deductibles, and mileage |
| Maintenance and repairs | Your estimate | Your estimate | Specific year, mileage, condition, and applicable coverage or prepaid service |
| Taxes, registration, and other use costs | Your figure | Your figure | Same locality and scope; include parking or tolls only if relevant |
| Total, average per month, cost per mile | Calculated | Calculated | Same time horizon and total miles |
Interpret the category totals before declaring a winner. A lower fuel estimate may be outweighed by a higher insurance quote or a different resale assumption. If a result is close, identify which uncertain inputs could change the order—often resale value, repair assumptions, or insurance—and test reasonable alternatives. Do not present a small difference as decisive when it depends on estimates rather than firm quotes.
Common calculation mistakes to avoid
- Counting purchase price and depreciation twice. In an economic-cost total, use depreciation as acquisition amount minus resale proceeds, then add interest and operating costs. If you show full purchase outflow, label the worksheet as cash flow and account for resale proceeds there.
- Adding full loan payments to the purchase price. Loan payments contain principal and interest. When the purchase price is already represented in the depreciation calculation, add interest rather than principal a second time.
- Using advertised MSRP as the buyer’s total price. MSRP is not the negotiated price and does not automatically include taxes, title, registration, add-ons, or all location-specific charges.
- Comparing different trims, years, or powertrains without saying so. The 2026 LE and LX figures apply to those base trims; they do not establish the result for other trims or hybrids.
- Using mismatched assumptions. Different annual miles, loan terms, insurance coverage, or ownership periods can make a comparison reflect the assumptions rather than the cars.
- Treating EPA mileage as a guarantee. The ratings are comparison estimates. Driving style, route, conditions, and maintenance affect actual fuel use.
- Treating warranty coverage as a maintenance budget. A whole-vehicle warranty does not mean scheduled service, wear items, or all repairs are free.
- Calling an estimate a universal ownership cost. Costs depend on location, driver, financing, used-car condition, and resale market. State assumptions and distinguish estimates from quotes.
What the 2026 comparison can—and cannot—tell you
For the specific 2026 Corolla LE and Civic LX base-trim figures in Toyota’s comparison, the Civic starts $1,570 higher by listed MSRP ($24,695 versus $23,125), while its listed combined fuel rating is one mpg higher (36 versus 35). The same comparison lists a $1,295 delivery charge for each. Honda’s comparison confirms the city/highway/combined ratings and cautions that actual mileage varies. These facts can inform a calculation, but neither starting MSRP nor a one-mpg rating difference determines total cost of ownership.
The cited comparison also reports a longer included scheduled-maintenance term for the Corolla LE—24 months or 25,000 miles—than for the Civic LX—12 months or 12,000 miles. Treat those as reported terms, not a guarantee for every location or transaction; check the offer and purchase documents that apply to your car. The comparison reports the same 36-month/36,000-mile whole-vehicle warranty for both vehicles, which should be considered separately from scheduled service.
A matched, independent Corolla-versus-Civic total cannot be calculated from those official comparison facts alone: they do not supply your purchase price, financing, insurance, local taxes, repair experience, or expected resale values under a shared ownership scenario. Your own worksheet is the defensible way to answer which one costs less for you over five years—or over any other period.
Quick Recap
Product prices and availability are accurate as of the date/time indicated and are subject to change. Any price and availability information displayed on Amazon at the time of purchase will apply.
What’s actually slowing this PC down?
Pick the symptom - the matching free tool is one click away.