The real cost of owning a car is its annual depreciation, financing charges, fuel or charging, insurance, maintenance and repairs, tires, licensing and taxes, plus any material parking and tolls. Add those annual amounts for a total, then divide by the miles you drive in a year for a cost-per-mile figure. A loan payment by itself is a cash-flow measure, not a complete ownership-cost calculation.
Use your own resale estimate, insurance quote, local prices and service records wherever possible. National averages are useful checks, but they cannot account for your driver profile, location, vehicle, mileage or driving conditions.



As an Amazon Associate I earn from qualifying purchases.
Use this formula for a personal ownership estimate
Choose an ownership period (for example, five years) and an annual mileage. Estimate each cost over that period, convert it to an annual amount, and add the categories:
Annual ownership cost = depreciation + financing charges + fuel/charging + insurance + maintenance, repairs and tires + licensing, registration and taxes + parking and tolls.
Cost per mile = annual ownership cost ÷ annual miles driven.
For a comparison, keep the ownership period, annual mileage, location, financing assumptions and insurance coverage identical for every vehicle. Report both the annual total and the per-mile result; a low fuel bill can be outweighed by depreciation, insurance or fees.
1. Calculate depreciation, the cost most budgets miss
Depreciation is the value the car loses while you own it, whether or not you have a loan. Estimate it as:
Free tools Windows power users keep installed
One-click scans. No signup required.
(Purchase price + acquisition costs − expected resale or trade-in value) ÷ years owned = annual depreciation.
Include sales tax, documentation charges and other acquisition costs when they materially increase what you paid. Use a realistic private-sale or trade-in value at the end of your chosen period, not the vehicle’s original sticker price. A car that is paid off still incurs depreciation because you could sell it for less than you paid.
Do not count principal repayment twice
Loan principal converts cash into equity in the car; it is not a second economic loss alongside depreciation. For a total-cost calculation, count depreciation and the interest or finance charges attributable to the period. For a household cash-flow budget, show the full loan payment as a separate cash requirement, but do not add the principal payment to depreciation as if both were independent costs.
Make the resale assumption explicit
Write down the expected sale date, mileage, condition and whether the figure is a trade-in or private-sale estimate. A longer ownership period usually spreads the original purchase cost over more years, but it can also bring higher repair risk. If you compare a new car with a used one, use the same number of years and miles and estimate each vehicle’s value at the same endpoint.
The Tool Desk
Outbyte Driver Updater FREEScan for outdated or missing drivers - takes under a minuteDriver Scan →Outbyte PC Repair FREERepair Windows errors before they cause bigger problemsFix Now →2. Add financing charges without confusing cash flow and cost
Use the lender’s amortization schedule to total interest and other finance charges paid during the ownership period. If you sell or refinance before the loan ends, include only the charges attributable to the period being analyzed. Record the down payment and principal in a cash-flow view; the economic-cost view already captures the car’s value through depreciation.
When comparing vehicles, hold the term, interest rate, down payment and tax treatment constant if your goal is to compare the cars rather than different loans. If the actual offers differ, show that difference separately so the reader can see whether the result is caused by the vehicle or the financing.
3. Estimate gasoline or charging from real use
Gasoline and diesel
Use your expected annual miles, real-world fuel economy and the price you actually pay:
Annual fuel cost = annual miles ÷ real-world miles per gallon × price per gallon.
What’s actually slowing this PC down?
Pick the symptom - the matching free tool is one click away.
Replace laboratory fuel-economy figures with a reasonable combined figure for your routes, weather, load and driving style. If you drive in a city, tow, idle frequently or use winter fuel, your result can be materially higher than a window-sticker estimate. State the fuel price and date because local prices change.
Electric vehicles and plug-in hybrids
For an EV, use expected kilowatt-hours per mile and the price for each charging source:
Annual charging cost = annual miles × kWh per mile × electricity price per kWh.
Separate home, workplace and public charging when their prices differ. Include charging losses if your efficiency figure does not already do so, and use the vehicle’s electric-only miles for a plug-in hybrid before calculating any gasoline used for the remaining miles. A low energy bill does not prove a lower total ownership cost: depreciation, financing, insurance, taxes and fees still apply.
Recommended Free Tools
AAA price inputs are dated benchmarks, not your rate
AAA’s September 15, 2026 release used $4.152 per gallon for gasoline and 18.0 cents per kWh for home electricity in its study. Those are dated study inputs, not current prices in every state or utility territory. Replace them with your local receipts or tariff.
4. Use an insurance quote for the actual driver and car
Insurance can vary more than fuel economy. Obtain a current quote for the exact vehicle identification, garaging ZIP code, annual mileage, drivers, limits, optional coverage and deductible. Record whether the quote includes collision, comprehensive, rental reimbursement, roadside assistance and any discounts. Use the six- or 12-month premium and annualize it; do not substitute a national average when you can get a quote.
As a reference, AAA’s 2025 study used $1,694 per year for full coverage for personal use by a driver under 65 with more than six years of driving experience, no accidents and a suburban or city residence. That is a study assumption, not a typical price for every driver.
5. Budget maintenance, repairs and tires as an irregular reserve
Start with the manufacturer’s maintenance schedule: oil or fluid services, filters, inspections, belts, spark plugs, brake work and other mileage-based items. Add the vehicle’s service history, warranty coverage, tire replacement interval and local shop estimates. For a used car, inspect the condition of brakes, tires, suspension, battery, cooling system and timing components before choosing a reserve.
Do not assume every year costs the same. Allocate known scheduled work to the year it is due, estimate likely repairs over the full ownership period, then divide the total by the years. This smooths a large repair without pretending it occurs every year. No universal maintenance allowance can represent every used vehicle; local estimates and the car’s history are more useful than an unsupported average.
Track spending so the estimate improves
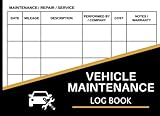
Keep a log with service date, odometer reading, work performed, parts, labor and tires. A paper or digital maintenance log helps reveal your actual annual reserve, but it does not calculate depreciation, insurance or total ownership cost. Include roadside failures and one-time repairs in the period total rather than hiding them as exceptional events.
Rank #4

- Made in USA - Proudly produced in Ohio by a Veteran-owned business
- This book will help you remember your last oil change /last service appointment. You can easily track all services, mileage and maintenance for multiple automobiles - great for business or personal use.
- The yearly expense summary is a very important part of this book. The yearly summary page is a perfect tool for your tax prep and your budget. After every month you should log your total business miles and personal miles in the “Annual Mileage Summary” page.
- This book comes in two convenient sizes, 8.5” x 11” - perfect to fit into any binder or clipboard that you may use for business and 5” x 7” which is the perfect size to fit into your glove compartment!
- Our unique cover is a semi-rigid transparent cover that leads to a sturdy book that resists stains and wrinkles. Reorder SKU: LOG-100-57CW-PP(Auto-Maintenance)
6. Add licensing, registration and taxes
List purchase sales tax, title and documentation charges, recurring registration, inspection or emissions fees, property or personal-property tax where applicable, and any annual local charges. Separate one-time acquisition costs from recurring costs, then annualize one-time items over the ownership period. Fees differ by state, county, vehicle value and fuel type, so use the relevant government schedule for your address.
7. Include parking and tolls when they are material
Commuter parking, residential permits, garage rent, toll roads, bridges and congestion charges can exceed fuel for some drivers. Add the amount you would actually pay for this vehicle and usage. If you would incur the cost regardless of which car you own, show it separately from vehicle-specific costs so a comparison remains meaningful.
A worksheet you can reuse
Enter annual amounts in the second column and document the source or assumption in the third. The monthly figure is the annual amount divided by 12; it is a budgeting view, not an additional cost.
| Cost category | Annual amount | Source or assumption to record |
|---|---|---|
| Depreciation | Purchase and acquisition costs minus expected resale, divided by years | Purchase date, endpoint mileage, sale or trade-in estimate |
| Financing charges | Interest and other finance charges for the period | Loan amortization schedule and term |
| Fuel or charging | Miles ÷ mpg × fuel price, or miles × kWh/mile × electricity price | Annual miles, real-world efficiency, charging mix and dated prices |
| Insurance | Annual premium | Current quote, driver, address, limits and deductible |
| Maintenance, repairs and tires | Scheduled and expected irregular work divided by years | Manufacturer schedule, service history and local estimates |
| License, registration and taxes | Recurring charges plus annualized one-time fees | State and local schedules |
| Parking and tolls | Expected annual use | Receipts, permits and route costs |
| Total | Sum of annual amounts | Divide total by annual miles for cost per mile |
Worked example with clearly stated assumptions
The following is an illustration, not a market quote. Suppose a car costs $32,000 including acquisition charges, should be worth $17,000 after five years, and will be driven 12,000 miles per year. Assume $700 in annual finance charges, 30 mpg, $3.80 gasoline, an $1,800 insurance quote, $1,200 for maintenance, repairs and tires, $400 in annual licensing and taxes, and $600 for parking and tolls.
- Depreciation: ($32,000 − $17,000) ÷ 5 = $3,000 per year.
- Fuel: 12,000 ÷ 30 × $3.80 = $1,520 per year.
- Add the stated annual amounts: $3,000 + $700 + $1,520 + $1,800 + $1,200 + $400 + $600 = $9,220.
- Cost per mile: $9,220 ÷ 12,000 = about $0.77 per mile.
Changing only the resale estimate, mileage, insurance quote or repair reserve changes the answer. That sensitivity is why a personalized worksheet is more useful than a single national number.
Independent reader supportYour contribution helps us test, update, and keep practical guides available for everyone.What current national benchmarks can—and cannot—tell you
AAA’s September 2026 Your Driving Costs analysis estimates an average $12,863 per year, or $1,071.92 per month, to own and operate a new vehicle. The analysis covers personal transportation over five years and 75,000 miles. AAA says actual costs vary with driving habits, location, operating conditions and other factors, and that its methodology changed, making the 2026 result not directly comparable with its 2025 estimate.
PC Slower Than It Used to Be?
A free scan shows the junk files, broken settings and background clutter dragging Windows down - then fixes them in one click.Free scan · Windows 10 & 11Crashes, No Sound, or Screen Glitches?
Random freezes, missing sound and display glitches usually trace back to one bad driver. Find and replace yours safely.Free scan · under a minute| AAA figure | Scope and qualification |
|---|---|
| $4,422 depreciation per year | Weighted average in the 2026 study; AAA identifies depreciation as its largest category. |
| $39,376 average MSRP | Sales-weighted new-vehicle MSRP in the study, not necessarily the transaction price after incentives or negotiation. |
| $4.152 per gallon; 18.0 cents per kWh | Gasoline and home-electricity inputs used for that dated study. |
| $12,863 per year; $1,071.92 per month | Five-year, 75,000-mile new-vehicle average; not a universal household budget. |
For historical context, AAA’s 2025 brochure and 2025 fact sheet reported $11,577 per year ($964.78 per month), $4,334 in annual depreciation, $1,694 in insurance, $813 for license, registration and taxes, and $1,131 in finance charges. They also reported 13 cents per mile for fuel and 11.04 cents per mile for maintenance, repair and tires. Those are study averages with stated assumptions; AAA’s methodology warning means the 2025 and 2026 totals should not be treated as a clean year-to-year trend.
Best Value
AAA’s 2026 release also compares selected EVs, hybrids and gas vehicles in four vehicle categories. Those selected-model results should not be compared directly with the full-study average; use them only when the category, model and assumptions match your decision.
How to compare two cars fairly
Build one column per vehicle and keep every external assumption constant. Compare these items over the same years and miles:
| Comparison item | What to hold or estimate |
|---|---|
| Total annual cost | Sum of all annual categories, including depreciation and finance charges. |
| Cost per mile | Annual total divided by the same annual mileage. |
| Purchase price and resale | Use transaction prices and endpoint values to derive depreciation. |
| Fuel or charging | Use each vehicle’s real-world efficiency but the same dated local energy prices. |
| Insurance | Quote each vehicle for the same driver, address, limits and deductible. |
| Maintenance, repairs and tires | Use schedules, histories and local estimates for each model. |
| Fees and taxes | Apply the same jurisdiction and include vehicle-specific taxes where relevant. |
| Financing | Use the same term and rate, or show actual offers separately from vehicle costs. |
Compare vehicles serving the same use case. A smaller commuter, a three-row SUV and a work truck may have different capacity and operating requirements, so a lower dollar figure alone does not establish better value.
Quick wins for a faster PC:
Scan for outdated or missing drivers - takes under a minuteDriver Scan →Repair Windows errors before they cause bigger problemsFix Now →Fix the driver behind crashes, sound loss and screen glitchesFind Drivers →Common mistakes that distort the result
- Counting only the payment: a payment can hide depreciation, and principal is not a second loss to add on top of it.
- Using the window-sticker economy: traffic, weather, load and speed change real consumption.
- Applying someone else’s insurance: driver, ZIP code, limits and deductible can change the premium substantially.
- Ignoring irregular repairs: tires, brakes, batteries and major services arrive in clusters; spread expected costs over the chosen period.
- Mixing time horizons: do not compare a three-year lease-style estimate with a five-year ownership estimate.
- Changing mileage between cars: per-mile costs are meaningful only when annual miles are the same.
- Treating dated averages as current prices: replace study fuel, electricity and insurance assumptions with current local inputs.
- Leaving out local fees: registration, inspections, property taxes, tolls and parking can be material.
- Double-counting shared costs: show unavoidable household expenses separately when they do not change with the vehicle.
Do not confuse ownership cost with IRS mileage rules
The IRS 2025 standard mileage rate is $0.70 per mile for eligible business use in the 2025 tax year. It is a tax calculation method, not a measurement of what a household spends to own a car and not automatically available for every trip.
The IRS Local Standards: Transportation page lists a $703-per-month ownership allowance for one car under standards effective June 29, 2026, with separate regional and metropolitan operating-cost allowances. Those standards support federal tax administration; they are not a consumer ownership benchmark. For eligibility and recordkeeping, consult the current IRS guidance or a tax professional.
How to keep the estimate current
- Save the purchase contract, loan schedule, insurance declarations and registration bills.
- Record odometer readings, fuel or charging sessions, service invoices, tires, parking and tolls throughout the year.
- Once or twice a year, replace estimates with actual insurance, energy and maintenance figures.
- Update the expected resale value and remaining loan balance when the market or your mileage changes.
- Recalculate annual and per-mile costs before replacing the vehicle, using the same assumptions for every candidate.
The result is a decision tool, not a permanent price tag. State every assumption beside the number, and the worksheet will show which cost is driving the decision and which input deserves a better quote.
Quick Recap
Product prices and availability are accurate as of the date/time indicated and are subject to change. Any price and availability information displayed on Amazon at the time of purchase will apply.