Do these 3 things before closing this tab:
1Fix the driver behind crashes, sound loss and screen glitches2Clear out junk files and repair common Windows errors3Scan for outdated or missing drivers - takes under a minuteUsually, no—not for modern cars. U.S. Environmental Protection Agency comparisons of vehicles sold with the same engine and either transmission show that manuals were generally more efficient through about 2010, but modern automatics are now more efficient on average. The U.S. Department of Energy dates the average crossover to model year 2016. Those are U.S. fleet and matched-vehicle trends, not a promise for every individual car. To choose between two versions, compare the official fuel-economy ratings for the exact model year, engine, body or drivetrain configuration, and transmission.
What the evidence says
The strongest broad comparison comes from the EPA’s Automotive Trends work. It compares manual and automatic versions offered within the same model and fitted with the same engine, rather than comparing unrelated cars. That design removes much of the confusion caused by different engines, vehicle sizes and equipment. Even so, the result is an average pattern across vehicles, not a rule that determines the winner for every model.

As an Amazon Associate I earn from qualifying purchases.
EPA summarizes the historical change plainly: “Vehicles with a manual transmission were more efficient than their automatic counterparts through about 2010, but modern automatic transmissions are now more efficient.” The statement appears in the 2020 EPA Automotive Trends Report (published January 2021).
The Department of Energy’s March 30, 2020 summary gives the crossover a more specific fleet date: beginning with model year 2016, automatic transmissions provided better average fuel economy than manuals. DOE says its chart is based on the EPA’s 2018 Automotive Trends Report. The comparison uses a production-weighted harmonic mean, and 2018 production data were preliminary, so the date describes an industry average rather than a universal percentage advantage.
#1 Best Overall
Why automatics overtook manuals
More usable gear ratios
Modern automatic transmissions typically offer more forward gears than older automatics and can keep the engine closer to an efficient operating range. EPA’s 2023 report lists fleet-average gear counts of six for manuals and 7.8 for automatics in model year 2022. EPA also says automatics passed manuals in average gear count in model year 2012. These are averages for U.S. new light-duty vehicles, not specifications for any particular car.
Earlier torque-converter lockup
Traditional automatics lose energy when their torque converter allows slip. Newer designs lock the converter earlier and use that direct mechanical connection over more of the drive cycle. EPA identifies earlier torque-converter lockup, together with the faster growth in automatic gear counts, as an important reason the efficiency ranking changed.
Transmission controls and vehicle integration
Electronic controls can select gears quickly and coordinate shifting with the engine, throttle and emissions systems. Automatics can also use tall top gears, multi-clutch arrangements or continuously variable designs, depending on the vehicle. The official trend does not mean every automatic uses the same technology; it means the broad class has improved enough that its average test results now exceed manuals.
Crashes, No Sound, or Screen Glitches?
Random freezes, missing sound and display glitches usually trace back to one bad driver. Find and replace yours safely.Free scan · under a minuteWindows Errors? Fix Them Before They Spread
Repair common Windows errors and clear accumulated junk for a smoother, more stable PC - no reinstall needed.Free scan · no reinstallWhat the 2022 gear-count figures do—and do not—tell you
| Model year and source | Manual average | Automatic average | How to interpret it |
|---|---|---|---|
| 2022, EPA 2023 Automotive Trends Report | 6 gears | 7.8 gears | Fleet averages for U.S. new light-duty vehicles; not a rating for a specific model |
| 2012, EPA trend | Below automatic average | Passed manual average | The year automatics first exceeded manuals in average gear count |
| Beginning model year 2016, DOE summary | Lower average fuel economy | Higher average fuel economy | Production-weighted average in the EPA comparison; not a guaranteed gap for each vehicle |
Gear count alone cannot predict fuel use. A six-speed manual with well-chosen ratios may outperform a poorly calibrated eight-speed automatic in a particular application, while a modern automatic may keep its engine in an efficient range more consistently than an average driver can. Final-drive ratio, vehicle mass, aerodynamics, tires, engine calibration and the test cycle all matter.
How to compare a specific car
The fleet trend is useful context, but the exact fuel-economy listing for the car you might buy is the decision-making evidence. EPA’s Automotive Trends data are based on EPA testing or manufacturer submissions using official EPA test procedures. Start with the official listing or window label for the same model year, then work through the following checks.
- Match the model year. A transmission, engine tune or final-drive ratio can change between years. Do not use a rating from a previous generation as a substitute.
- Match the engine. Compare the same displacement, cylinder count, aspiration and, where listed, output. A manual paired with a smaller engine is not a fair transmission comparison with a larger-engine automatic.
- Match body and drivetrain. Check whether each vehicle is a hatchback, sedan, wagon, pickup or SUV, and whether it is front-wheel drive, rear-wheel drive or all-wheel drive. Body style and driven wheels can change the official rating substantially.
- Match the transmission entry. Confirm the number of manual gears or the exact automatic type shown in the official listing. Some vehicles offer more than one automatic or a manual only on one trim.
- Compare the same rating basis. Put city, highway and combined values side by side. A combined number is not interchangeable with a highway number, and a difference in test-cycle labeling can make figures from different markets incomparable.
- Check the units and market. EPA figures are U.S. values. Other countries may use different test cycles, conversion conventions or equipment definitions. Do not transfer the U.S. fleet conclusion directly to another market without local data.
| Comparison item | Why it matters | Common mistake |
|---|---|---|
| Model year | Ratings and hardware change over time | Using a current rating for an older used car |
| Engine | Power and efficiency can dominate the transmission effect | Comparing different engine options |
| Body/drivetrain | Weight, drag and driven wheels affect consumption | Comparing two different body styles or AWD and 2WD |
| City/highway/combined basis | Each number describes a different test weighting | Calling a highway difference a general MPG advantage |
| Country and test cycle | Official procedures are not globally identical | Mixing U.S. EPA and non-U.S. figures as if they were one test |
Does the driver’s shifting technique change the answer?
Yes, it can change an individual car’s consumption, but the cited EPA and DOE material does not establish a reliable universal percentage for shifting skill. A manual driver chooses shift points, controls clutch slip and decides when to downshift. Smooth acceleration, avoiding unnecessary high revs and selecting an appropriate gear can reduce waste; lugging the engine, repeated high-rpm acceleration or prolonged clutch slip can increase it.
Rank #3

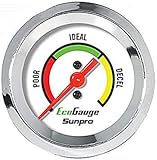
- Plug and Play: This automotive gauge is easy to install, requiring no complicated wiring or professional installation; it connects directly to the vehicle's system.
- Fuel Economy Monitoring: Designed to help track and optimize fuel consumption, allowing drivers to monitor vehicle efficiency and potentially reduce fuel costs.
- Portable Design: This compact and lightweight gauge can be easily moved between different vehicles or removed when not needed. This fuel economy monitor can easily fit into your armrest box.
- Universal Compatibility: Suitable for vehicles using gasoline, diesel, water, and lubricants, making it suitable for a wide range of automotive applications.
An automatic makes those decisions itself, and its calibration is part of the vehicle’s tested specification. A skilled manual driver may beat an automatic in a particular route, while another driver may obtain worse results because of late shifts, aggressive launches or frequent clutch use. That variability is why a personal result should not be presented as proof that manuals—or automatics—are inherently superior.
What the EPA trend covers
The EPA’s reports concern U.S. new light-duty vehicles and use official EPA test procedures or manufacturer-submitted data subject to those procedures. The comparison is valuable because it follows the same-model, same-engine framing, but it remains a fleet statistic. It does not provide a controlled global experiment, a guaranteed result for every current transmission type, or a universal MPG difference.
The EPA’s introduction to the Automotive Trends Report explains the report’s scope and methods. The newer 2023 EPA Automotive Trends Report supplies the 2022 average gear counts. Because the reports summarize historical model years, they should be used to understand the direction of the market, not to replace the label for a specific vehicle on a dealer lot.
Rank #4

- Adjusts speed limiter
- Read and erase trouble codes
- See instant fuel economy
- Customize gauges and set safety warnings
When a manual may still make sense
Fuel economy is only one ownership criterion. A manual may be the only transmission offered with a particular engine or trim, and some drivers prefer its control or engagement. Those are legitimate reasons to choose one, but they are different from claiming a blanket fuel-saving benefit. If fuel cost is the deciding factor, use the exact official ratings and your driving pattern rather than an assumption based on transmission type.
- For heavy urban traffic, compare the city rating and consider how often stop-and-go driving occurs.
- For long motorway trips, compare highway ratings, gearing and the speed you actually drive.
- For mixed use, compare combined ratings and then adjust expectations for weather, cargo, hills and traffic.
- For a used vehicle, inspect condition as well as transmission: tire pressure, maintenance, alignment and engine faults can outweigh a small catalog difference.
Practical decision rule
If both transmissions are available on the same car, choose the version with the better official city, highway or combined rating that matches your use, after confirming the engine and drivetrain are equivalent. If the ratings are close, transmission preference, traffic conditions, maintenance history and purchase price may matter more than a theoretical advantage. If the cars are from different markets or have no directly comparable official figures, treat the result as unresolved rather than assuming the manual saves fuel.
Bottom line
Manual cars are not categorically more fuel-efficient today. EPA data show that manuals led through about 2010, while DOE’s summary places the average U.S. crossover at model year 2016; by 2022, automatic vehicles averaged 7.8 gears versus six for manuals. For any purchase, compare the exact official ratings for model year, engine, body or drivetrain and transmission, and keep the result tied to the market and test procedure that produced it.
Quick Recap
Product prices and availability are accurate as of the date/time indicated and are subject to change. Any price and availability information displayed on Amazon at the time of purchase will apply.