People may associate certain car brands with aggressive or careless driving, but a stereotype is not proof about the typical owner. This article explains how performance, marketing, enthusiast culture, and viral media may shape those perceptions—and what the available evidence can and cannot establish.
The ten brands discussed here are BMW, Dodge, Nissan, Subaru, Audi, Tesla, Mercedes-Benz, Range Rover, Porsche, and Ford. These associations describe the CarCody article’s cultural framing, not a demonstrated ranking of their drivers.
What the evidence says—and does not say
The original article invokes insurance data, citations, crash reports, marketing, and media, but does not provide a transparent brand-level dataset or reproducible method for its claims. Assertions that a brand is overrepresented in citations or incidents should therefore be treated as unverified, not as established facts. A statistic about crashes or insurance inquiries also cannot, by itself, measure a brand’s cultural reputation.
The Insurance Institute for Highway Safety (IIHS) reports that 29% of U.S. motor vehicle crash deaths involved speeding in 2024. That national statistic describes speeding in fatal crashes; it does not identify the brands of the drivers involved or show that owners of one brand speed more than others.
Recommended Free Tools
#1 Best Overall
- 【Elegant Design】The keyring printed with logo is unique, perfectly matches with your cars. The key chain stand wear and tear which well-constructed design, and it’s convenient to use and carry the key chains no need to worry about losing your keys.
- 【Easy To Use】Make it much easier to detach or clip on your belt loopthe stylish appearance and practical features to create a unique keychain, adds elegance and charm to your belt.
- 【Multifunction】This fit any key chain is used to organize your home, car, and office's keys. It is practically suitable for both men and women. You can take it to everywhere.
- 【Premium Material】This key chain are made of high grade polished Zinc-iron alloy material, which is shining and looks luxury and beautiful,anti-rust and durable.
- 【Perfect Gift】The perfect gift for birthday, family or business gift. It can also be used as a keychain for car keys, motorcycle keys, home keys, etc.
IIHS also reports model-specific driver death rates for model-year 2023 vehicles: 127 driver deaths per million registered vehicle years for the Dodge Charger HEMI 2WD, 83 for the Subaru Impreza, and 27 for the BMW X5 4WD. These are rates for particular models, not brand-wide measures of owner behavior. The vehicles differ in class and exposure, and IIHS inclusion requires at least 100,000 registered vehicle years from 2021–2024 or at least 20 deaths.
LendingTree’s Best and Worst Drivers by Brand: 2026 Report analyzes QuoteWizard insurance inquiry data from January 1 through December 16, 2025. It reports incidents in that inquiry sample, aggregating incident types; it is not a census of all drivers or a direct measure of reputation. Any comparison from the report should be attributed to LendingTree and interpreted in light of its sample and measure.
Why these ten brands may attract stereotypes
The original article connects each brand with a familiar public narrative. Those connections are best understood as explanations of perception, not verified conclusions about how owners behave.
Rank #2

- Vibrant Colorful Key Chains Feature Fun Characters and Unique Logos
- Heavy Duty Chrome Plated Split Ring and Clip Secures Keys
| Brand | Perception described in the article | Evidence caveat |
|---|---|---|
| BMW | Aggressive driving and poor signaling jokes | No transparent brand-level citation or incident analysis is supplied. |
| Dodge | High-power muscle-car imagery | Performance or model death-rate figures do not establish how all owners drive. |
| Nissan | The Altima meme and visibility in everyday traffic | Anecdotes and visibility do not show a higher per-driver risk. |
| Subaru | WRX performance culture and modifications | Enthusiast culture is not a measure of typical owner conduct. |
| Audi | Quiet speed and understated performance | The article supplies no brand-specific evidence for its speeding claims. |
| Tesla | Instant torque, driver-assistance misunderstandings, and technology controversy | Attention around incidents is not evidence of a higher incident rate. |
| Mercedes-Benz | Status and perceived entitlement | This is a social perception, not a demonstrated behavioral finding. |
| Range Rover | Large vehicles used in urban settings | Size or awkward parking anecdotes do not establish owner behavior. |
| Porsche | High performance and public scrutiny | Media attention around a crash does not establish greater risk. |
| Ford | Mustang performance and viral mishaps | Viral clips show incidents, not the share of owners who drive recklessly. |
How reputations can form
Several mechanisms may help explain why a badge becomes shorthand for a driving stereotype. A powerful or responsive vehicle can make performance more visible; advertising may associate a product with confidence or excitement; owner communities can develop recognizable styles; and social media can spread dramatic incidents farther than uneventful daily driving. These are plausible cultural mechanisms, not proof that a particular brand’s owners are generally worse drivers.
Windows Errors? Fix Them Before They Spread
Repair common Windows errors and clear accumulated junk for a smoother, more stable PC - no reinstall needed.Free scan · no reinstallCrashes, No Sound, or Screen Glitches?
Random freezes, missing sound and display glitches usually trace back to one bad driver. Find and replace yours safely.Free scan · under a minuteVisibility also matters. A popular model may generate more sightings and clips simply because more of them are on the road. Without adjusting for exposure, driver demographics, vehicle use, and time period, raw incident counts can mislead. Likewise, a model-specific death rate measures a different outcome from citations or insurance inquiries; none should be casually substituted for another.
How to compare driving-risk claims
- Identify the measure. Check whether a claim concerns citations, insurance incidents, crashes, or deaths. These measure different things.
- Check the population and time window. Determine who was counted, where, and during which dates. An insurance-inquiry sample is not every driver.
- Check the unit. A finding about one model or trim does not automatically apply to every model from that brand.
- Look for exposure and demographic context. Comparisons may change with miles driven, vehicle use, driver age, and other factors. Do not infer a per-driver risk from raw counts alone.
- Separate evidence from cultural commentary. Memes and viral clips can explain a reputation, but they cannot establish how typical owners behave.
FAQ
Why do people think some car-brand drivers are bad?
Brand stereotypes can grow from memorable incidents, performance or status associations, owner-community signals, and repeated media coverage. Those factors can shape perception, but they do not prove that the typical owner behaves that way.
Rank #3
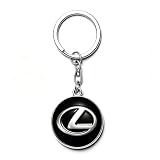
- 🚕 High-quality MATERIAL: The metal part is made of high zinc alloy material, the whole surface is electroplated and polished, very fashionable, convenient, durable, not easy to fade, easy to carry
- 🚕 STYLISH APPEARANCE: The iron part of the key fob is galvanised and looks shiny, the black metal key fob matches your car keys very well and can be rotated 360 degrees.
- 🚕 EASY TO USE: Easily hang on belt loops, lanyards, purses and wallets, small handbag accessories, pendants and gadgets. A unique accessory for key organisation and combinations.
- 🚕 WISE GIFT: This practical and good-looking car keychain can be given as a gift for Mother's Day/Father's Day, Christmas, a friend who just bought a new car or a family member's birthday.
- 🚕 AFTER-SALES SERVICE: If you have any questions, please contact us and we will reply you within 24 hours.
Does the IIHS speeding statistic show that some brands speed more?
No. IIHS reports that 29% of U.S. motor vehicle crash deaths involved speeding in 2024. That national statistic does not compare brands or measure the behavior of their owners.
Do IIHS driver death rates rank the worst brand owners?
No. The rates cited here concern specific model-year 2023 vehicles and driver deaths per million registered vehicle years. They are not brand-wide behavior rankings or judgments about owners.
Can insurance data prove which brand has the worst drivers?
Not on its own. LendingTree’s 2026 report uses QuoteWizard insurance inquiry data from January 1 through December 16, 2025, and aggregates incident types. Its findings describe that sample and measure, not all drivers or cultural reputation itself.
How should I judge a car’s safety or risk?
Compare clearly defined data for the vehicle models you are considering, including the outcome measured, time period, population, and exposure. Treat memes and anecdotes as cultural context rather than a substitute for evidence.
Quick Recap
Sources
- Insurance Institute for Highway Safety, “Yearly snapshot — Fatality statistics.”
- Insurance Institute for Highway Safety, “Driver death rates remain high for small cars, models with powerful engines.”
- LendingTree, “Best and Worst Drivers by Brand: 2026 Report.”
Product prices and availability are accurate as of the date/time indicated and are subject to change. Any price and availability information displayed on Amazon at the time of purchase will apply.